


 FxWirePro- Major Crypto levels and bias summary
  FxWirePro- Major Crypto levels and bias summary
  BTC’s Bear Bounce: Sell the Rally Near $66K as Bears Target $59K–$52K Breakdown


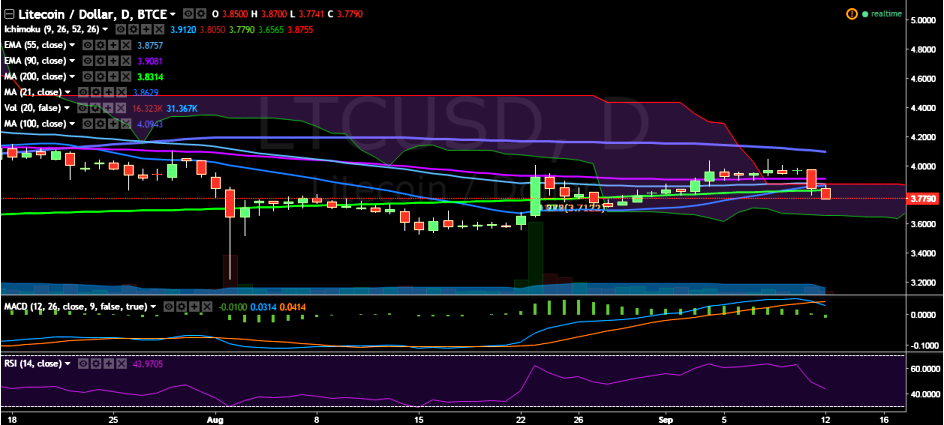
LTC/USD has considerably weakened after hitting 4.05 levels and has slipped below 200-day MA. It is currently trading at 3.80 levels at the time of writing (BTC-e).
Short-term trend: Bearish
Ichimoku analysis of daily chart:
Tenkan Sen: 3.92
Kijun Sen: 3.80
Trend reversal: 3.91 (90 EMA)
“LTC/USD is trading below 200-day MA currently and a close below this level would confirm further bearishness in the pair”, FxWirePro said in a statement.
The pair faces major resistance at 3.91 (90 EMA) and a break above would target 4.05 levels (September 08 high)/ 4.10 (100-day MA). The pair must break above 4.05 levels for further upside.
On the other side, support is seen at 3.63 (50% retracement of 3.22 and 4.05) and a break below would target 3.50 (psychological level)/ 3.22 (August 02 low).

- News

- Economy

- Central Banks
- Investing
- Research
- Roundups
- Digital Currency
- Insights
- Technical Analysis
- Technology
- Business
- Law
- Health
- Nature
- Fintech
- Science
- Topic
- Opinions
- ©Econometrics LLC . All Rights Reserved.
FxWirePro: LTC/USD breaks below 200-day MA, good to sell on rallies
Monday, September 12, 2016 11:46 AM UTC
Editor's Picks


- Market Data
Most Popular


