


 Gold Surges Past $4150 on Dovish Fed Signals and Weak Jobs Data; Bullish Outlook Prevails
  State of emergency in Crimea as Ukraine focuses pressure on ‘jewel in Putin’s crown’
  Alcohol is one of the most dangerous drugs, yet its presence is ubiquitous in social settings and celebrations
  Bank of America Upgrades T-Mobile to Buy, Says LEO Satellite Fears Are Overdone
  Bernstein Names IAG, Ryanair as Top European Airline Stocks Ahead of Earnings
  JPMorgan Cuts Gold Price Forecast, Sees Bullion Reaching $4,500 by End of 2026
  Elon Musk is remaking the world, like Henry Ford before him – but more dangerously
  USA at 250: the Black American struggle for life, liberty and the pursuit of happiness
  Buy the Dip: Gold Holds Strong at $3980, Targets $4150
  Vietnam’s population hit the 100 million milestone. Where’s it headed?


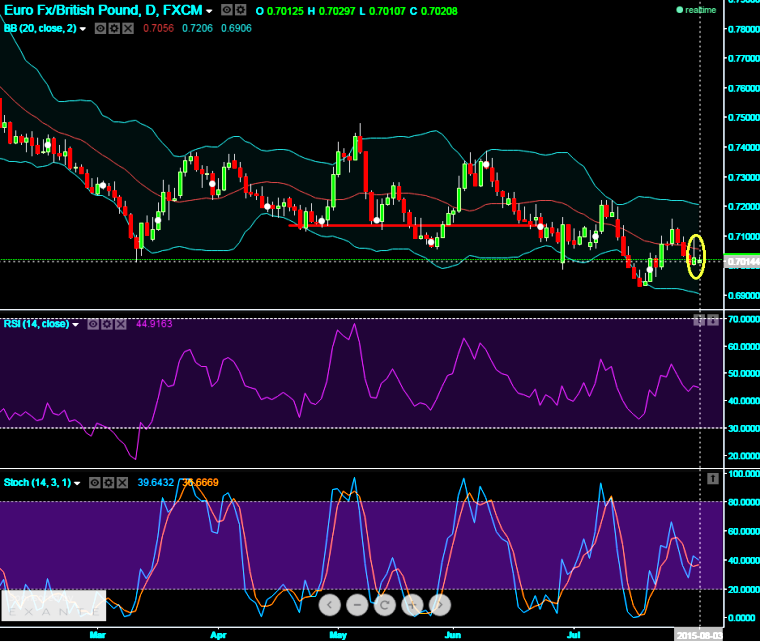
EOD technical charts have shown a slight recovery from last week's loses. An inverted hammer pattern is formed on Friday at 0.7027 levels and intraday sentiments are bullish bias but the healthy UK PMI is disturbing the rallies and leading indicators fortify these upswings with positive convergence.
Slight divergence on RSI is seen on daily charts as it is trending near 44.7875 levels with a supportive signal from stochastic curve as %K line crossover below 40 levels which is oversold territory. These signals can be attributed as positive movers for price recovery; however closing figures should be crucial for long-term decision making.
On a swing trading perspective, it is smart to buy at every dips, we advocate buying binary delta calls for targets of 20-25 pips. Intraday charts signals a sharp oversold situation as the %K line crossover occurred below 20 levels and RSI curve is also moving in convergence with spiking prices.

- News

- Economy

- Central Banks
- Investing
- Research
- Roundups
- Digital Currency
- Insights
- Technical Analysis
- Technology
- Business
- Law
- Health
- Nature
- Fintech
- Science
- Topic
- Opinions
- ©Econometrics LLC . All Rights Reserved.
FxWirePro: Inverted hammer formation signifies EUR/GBP’s recovery but UK PMI to disrupt; digital calls for 20 pips
Monday, August 3, 2015 9:07 AM UTC
Editor's Picks


- Market Data
Most Popular


