


 Gold's 365-Day EMA Streak Since Oct 2023 Faces Its First Real Test at $3,980 — Break or Bounce to $4,140?
  World Cup technology: from ref cams to AI analysts, cutting-edge research is changing the game
  How AI prompting turned writerly description into an everyday skill
  AI Memory Boom Sparks Global Chip Supply Crunch
  SpaceX Stock Gets $175 Target as Analysts See Massive Growth Ahead
  J.P. Morgan Sees Potential Vestas Guidance Upgrade Amid Strong Wind Energy Demand
  Goldman Sachs: US Dollar Likely to Stay Strong Despite Oil Price Retreat


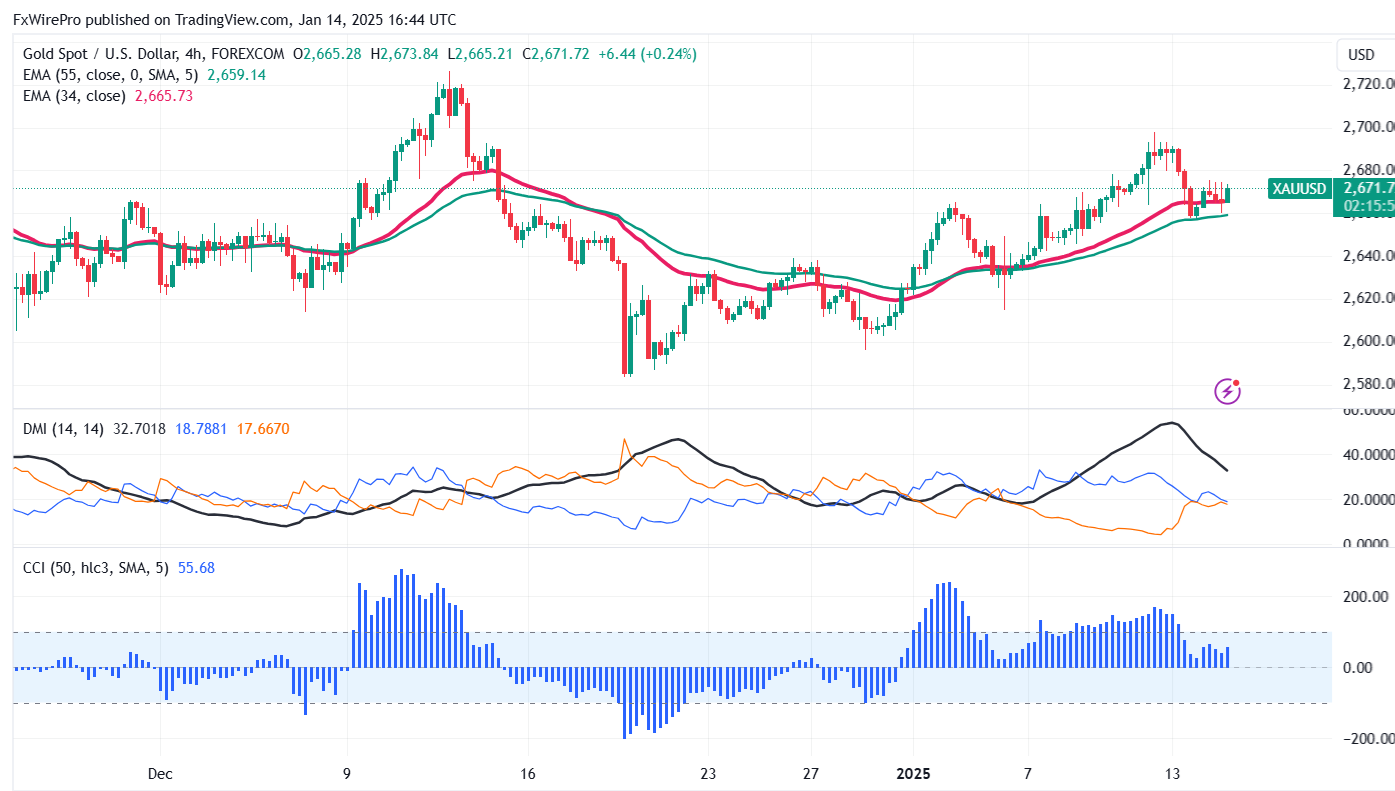
Gold prices showed a minor pullback after weak US PPI data. It hit a low of $2657 and currently trading around $2670.67.
As of December 2024, the Core PPI was reported unchanged for the month, falling below the expected 0.3% increase. The year-over-year growth of the Core PPI rose 3.5%, higher than November's 3.4% but still below the expectation of 3.8%. The overall PPI grew 0.2% for the month and 3.3% year-over-year, with less inflation than the expectation. This would suggest inflation is coming off, which would change how the Federal Reserve might go forward in terms of monetary policy. Consumer Price Index reports later this month will be very interesting.
Rate Pause Probability Rises Significantly
According to the CME Fed Watch tool, the chances of a rate pause have increased to 97.30% up from 93.60 % a week ago.
Technical Analysis: Support, Resistance, and Trading Strategy
Gold prices are trading above short-term moving averages 34 EMA and 55 EMA and long-term moving averages (200 EMA) in the 4-hour chart. Immediate support is at $2,650, and a break below this level will drag the yellow metal $2,630,$2600/ $2,570, $2,559, $2,536, and eventually $2,500. The near-term resistance is at $2700, with potential price targets at $2725/ $2,750-/$2775. It is good to buy on dips around $2660, with a stop-loss at $2,630 for a target price of $2,750


