


 FxWirePro: GBP/NZD downside pressure builds, key support levels in focus
  FxWirePro- Major Crypto levels and bias summary
  FxWirePro: EUR/AUD neutral in the near term, scope for downward resumption
  Crypto Bias Report: Trend Signals and Top Bullish Picks
  FxWirePro- Major Crypto levels and bias summary
  FxWirePro: GBP/AUD bears maintain upper hand
  BTC, ETH, SOL, XRP, and BNB: Major Crypto Pairs Stay Neutral
  NZDJPY Bullish Dip-Buy Setup: 93.60 Support Unlocks Path to 97
  FxWirePro: EUR/NZD downside pressure builds, key support level in focus
  FxWirePro: USD/ZAR surges as rand slumps after SARB rate hold surprise
  FxWirePro: USD/CNY edges higher but bulls lack punch
  JPY Action Bias: USDJPY, EURJPY, and CADJPY Emerge as Top Extremely Bullish Picks
  FxWirePro: GBP/USD slips as middle east tensions and oil surge pressure pound
  FxWirePro:USD/JPY hovers near a four-decade low
  FxWirePro- Major Pair levels and bias summary
  FxWirePro: GBP/AUD under pressure as pound continues to weaken


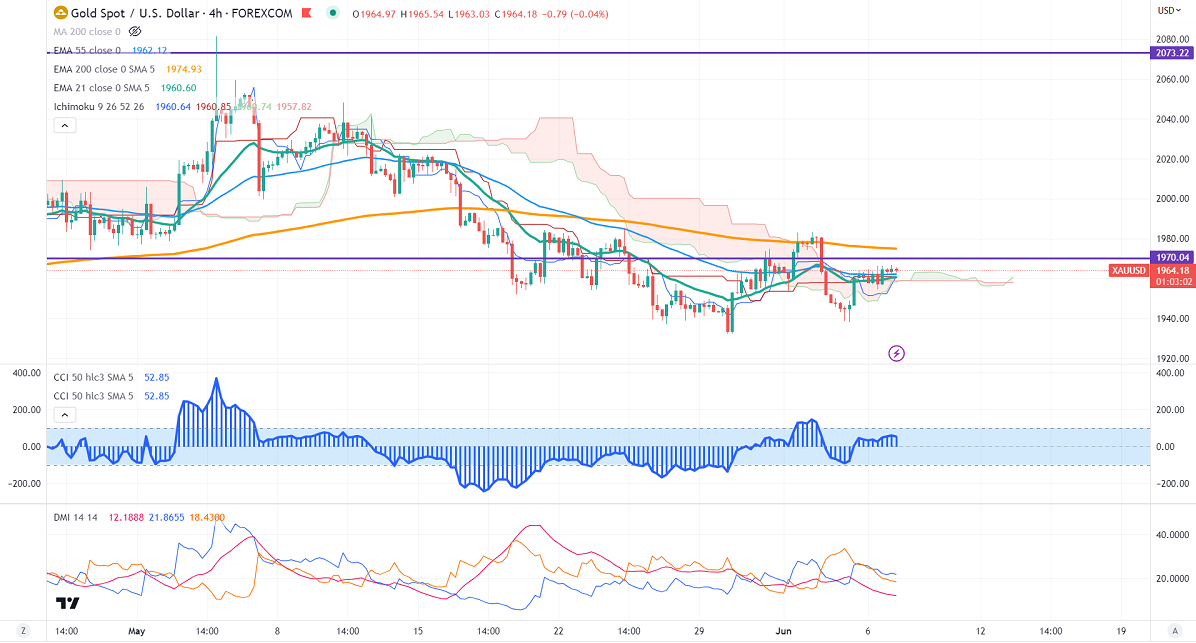
Ichimoku Analysis (4-Hour chart)
Tenken-Sen- $1956.80
Kijun-Sen- $1960.85
Gold prices are trading in a tight range after a nice recovery of more than $25. The weak US economic data and dovish comments from Fed officials support the yellow metal at lower levels. It hits an intraday high of $1966.83 yesterday and is currently trading around $1964.29.
US dollar index- Bullish. Minor support around 102.30/101.50. The near-term resistance is 104.40/105.
According to the CME Fed watch tool, the probability of a no-rate hike in June increased to 81% from 33.40% a week ago.
The US 10-year yield pared some of its gains in the hope of a dovish rate pause by the Fed. The US 10 and 2-year spread narrowed to -82.9% from -108%.
Factors to watch for gold price action-
Global stock market- bullish (negative for gold)
US dollar index - Bullish (negative for gold)
US10-year bond yield- Bullish (Bearish for gold)
Technical:
The near–term support is around $1935, a break below targets of $1920/$1900.The yellow metal faces minor resistance around $1965, and a breach above will take it to the next level of $1980/$2000/$2020/$2040/$2070/$2100/$2150.
It is good to sell on rallies around $1979-80 with SL around $2000 for TP of $1920/$1900.


