


 FxWirePro: USD/JPY dips as market assess risk of additional FX intervention.
  FxWirePro: USD/CAD retreats after Canada posts stronger-than-expected GDP growth
  US Magnificent 7 Stocks Trend Score: Amazon & Microsoft Hit Extreme Bullish (+100) as Meta Drops to -100 — Key Resistance & Support Watchlist
  Major European Indices Score Extremely Bullish: DAX Eyes 26000, CAC Targets 8600, FTSE100 at 11000 – Key Levels to Watch
  FxWirePro: USD/CNY dips to hit three year low,scope for further downside
  NZDJPY Retreats on Yen Strength – Bearish Setup Targets 90 After Hitting 92.75 Low
  AUDJPY Volatile After Massive Sell-Off: Sell Rallies at 113, Targeting 110 as Bearish Momentum Surges
  FxWirePro: GBP/NZD remains weak, eyes 38.2%fib support
  NZDJPY Bears Stay in Command: Sell Rallies at 92.72-75 Targeting 90 as All EMAs Flash Red
  FxWirePro: GBP/NZD remains weak, eyes 38.2%fib support
  FxWirePro- Major Crypto levels and bias summary
  AUDJPY Bears Tighten Grip: Sell Rallies at 110.65-67 Targeting 107.75 as All EMAs Stay Red
  FxWirePro: GBP/AUD drifts lower after BOE rate decision
  All Major JPY Pairs Hit Extreme Bearish Score of -100: USDJPY, EURJPY, GBPJPY, AUDJPY, NZDJPY & CADJPY Flash Maximum Weakness
  US Magnificent 7 Stocks Trend Score: Amazon & Microsoft Hit Extreme Bullish (+100) as Meta Drops to -100 — Key Resistance & Support Watchlist
  FxWirePro- Woodies pivot (Major)
  FxWirePro: NZD/USD consolidates overnight gains, but loses momentum


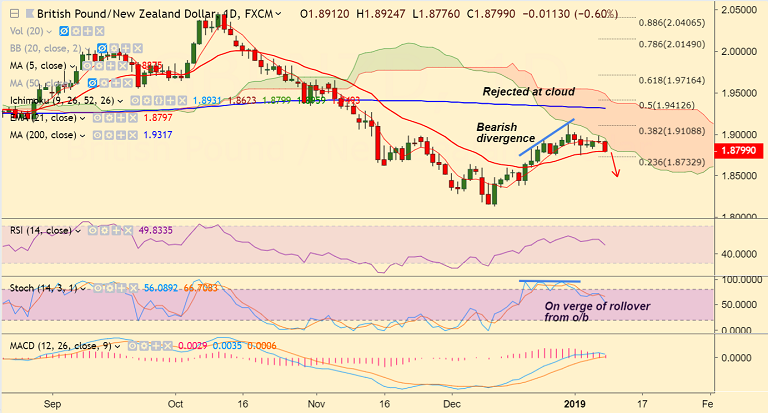
GBP/NZD chart on Trading View used for analysis
- GBP/NZD is trading 0.45% lower on the day at 1.8827 at 1030 GMT.
- The pair has been rejected at daily cloud with Doji formation raising scope for further weakness.
- Technical studies on daily charts are showing signs of slight bearishness.
- The pair finds strong support at 21-EMA at 1.8799, break below to see weakness.
- We notice a bearish divergence on Stochs which raises scope for downside in the pair.
- Break above cloud base required for upside continuation. Next major resistance above cloud base lies at 38.2% Fib at 1.91.
- Immediate support is seen at 21-EMA at 1.8798. Break below sees dip till 1.8732.
Support levels - 1.8798 (21-EMA), 1.8732 (23.6% Fib), 1.8625 (Nov 16 low)
Resistance levels - 1.8876 (5-DMA), 1.8959 (cloud base), 1.91 (38.2% Fib)
Recommendation: Good to go short on break below 21-EMA, SL: 1.8940, TP: 1.8730/ 1.87/ 1.8625
For details on FxWirePro's Currency Strength Index, visit http://www.fxwirepro.com/currencyindex.


