


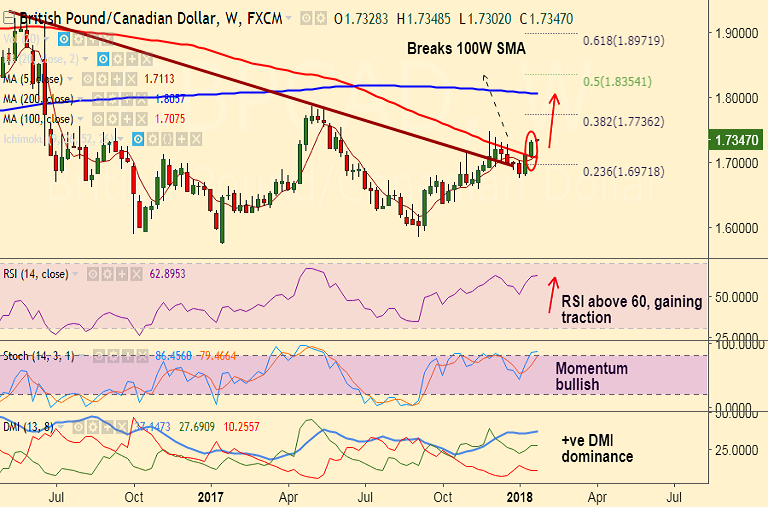
- GBP/CAD shows decisive break above 100W SMA. The pair closed above in last week's trade.
- Technical studies on weekly charts highly bullish. Price action is extending major trendline break.
- RSI and Stochs on weekly charts are highly bullish. We see +ve DMI dominance.
- On the daily charts the price action is above daily cloud and major moving averages.
- Immediate resistance lies at 38.2% Fib retrace of 2.09720 to 1.57361 fall at 1.7736.
- On the flipside, retrace and close below 100W SMA invalidates bullish bias.
Support levels - 1.7248 (5-DMA), 1.7109 (Ichi cloud), 1.7075 (100W SMA)
Resistance levels - 1.7465 (Nov 2017 highs), 1.7525 (Sept 2016 high), 1.7736 (38.2% Fib retrace of 2.09720 to 1.57361 fall)
Recommendation: Good to go long on dips around 1.7320, SL: 1.7250, TP: 1.7460/ 1.7525/ 1.76/ 1.7736
FxWirePro Currency Strength Index: FxWirePro's Hourly GBP Spot Index was at 140.481 (Bullish), while Hourly CAD Spot Index was at -145.66 (Bearish) at 0940 GMT. For more details on FxWirePro's Currency Strength Index, visit http://www.fxwirepro.com/currencyindex.
FxWirePro launches Absolute Return Managed Program. For more details, visit http://www.fxwirepro.com/invest


