


 FxWirePro- Major Pair levels and bias summary
  AUDJPY Volatile After Massive Sell-Off: Sell Rallies at 113, Targeting 110 as Bearish Momentum Surges
  NZDJPY Retreats on Yen Strength – Bearish Setup Targets 90 After Hitting 92.75 Low
  FxWirePro: USD/CNY dips to hit three year low,scope for further downside
  FxWirePro: GBP/NZD remains weak, eyes 38.2%fib support
  FxWirePro: AUD/USD gains some ground but outlook is bearish
  FxWirePro: GBP/AUD drifts lower after BOE rate decision
  US Magnificent 7 Stocks Trend Score: Amazon & Microsoft Hit Extreme Bullish (+100) as Meta Drops to -100 — Key Resistance & Support Watchlist
  FxWirePro: USD/ZAR gains as stronger dollar outweighs upbeat South Africa's trade surplus
  Major FX Action Bias & US Market Sentiment: NZD/USD (Extremely Bullish) & AUD/USD (Bullish) Watchlist
  FxWirePro: NZD/USD consolidates overnight gains, but loses momentum
  Major European Indices Score Extremely Bullish: DAX Eyes 26000, CAC Targets 8600, FTSE100 at 11000 – Key Levels to Watch
  FxWirePro: USD/CAD retreats after Canada posts stronger-than-expected GDP growth
  FxWirePro: GBP/USD rises as soft US data pressures dollar
  NZDJPY Bullish Rebound: Buy Dips as EMAs Align for 97 Target
  AUD/JPY Slips Below 112 as BOJ Intervention Sparks Bearish Momentum: Sell the Rallies


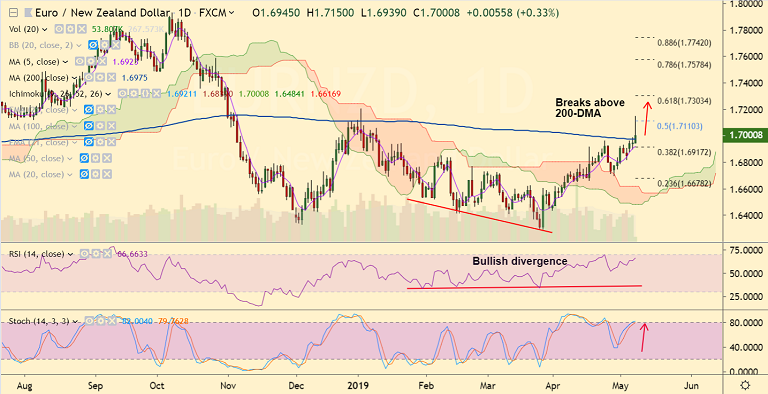
EUR/NZD chart - Trading View
Technical Analysis: Bias Bullish
- The pair has hit 4-month highs above 1.71 handle before paring some gains
- Price action has bounced off 20-DMA support and has broken above 200-DMA
- Momentum studies bullish, Stochs and RSI are sharply higher. Bullish divergence adds to bullish bias
- The pair trades above daily cloud and major EMAs and volatility is rising
- Close above 200-DMA will see further gains in the pair. Scope for test of 0.7201 (Jan 3rd high)
- Failure to close above 200-DMA could see retrace till 0.6820 (nearly converged 20-DMA and 21-EMA)
Support levels - 1.6975 (200-DMA), 1.6924 (5-DMA), 1.6820 (nearly converged 20-DMA and 21-EMA)
Resistance levels - 1.71, 1.72, 1.7303 (61.8% Fib)
Recommendation: Good to go long on close above 200-DMA, SL: 1.6820, TP: 1.7110 (50% Fib), 1.72, 1.7303 (61.8% Fib)
For details on FxWirePro's Currency Strength Index, visit http://www.fxwirepro.com/currencyindex.

- News

- Economy

- Central Banks
- Investing
- Research
- Roundups
- Digital Currency
- Insights
- Technical Analysis
- Technology
- Business
- Law
- Health
- Nature
- Fintech
- Science
- Topic
- Opinions
- ©Econometrics LLC . All Rights Reserved.
FxWirePro: EUR/NZD Trade Idea
Wednesday, May 8, 2019 6:08 AM UTC
Editor's Picks


- Market Data
Most Popular


