


 Nikkei Surges Past 65,000 on Suspected Yen Weakness: Tech Giants Like Advantest and NEC Lead Explosive Gains
  FxWirePro: GBP/USD rises as soft US data pressures dollar
  Major FX Action Bias & US Market Sentiment: NZD/USD (Extremely Bullish) & AUD/USD (Bullish) Watchlist
  FxWirePro: AUD/USD dips below lower range, bearish bias increases
  FxWirePro: USD/CAD slips after Fed holds rates steady
  NZDJPY Bullish Rebound: Buy Dips as EMAs Align for 97 Target
  FxWirePro- Major Pair levels and bias summary
  FxWirePro: USD/JPY edges higher as focus shifts to BOJ decision
  FxWirePro: GBP/AUD drifts lower after BOE rate decision
  FxWirePro- Major Crypto levels and bias summary
  FxWirePro: NZD/USD consolidates overnight gains, but loses momentum
  FxWirePro : GBP/NZD strongly bearish despite upside attempts
  FxWirePro: AUD/USD gains some ground but outlook is bearish
  FxWirePro- Major Pair levels and bias summary
  FxWirePro:EUR/NZD gains some upside momentum but still bearish
  FxWirePro:USD/JPY climbs back above 160.00 after BOJ rate decision


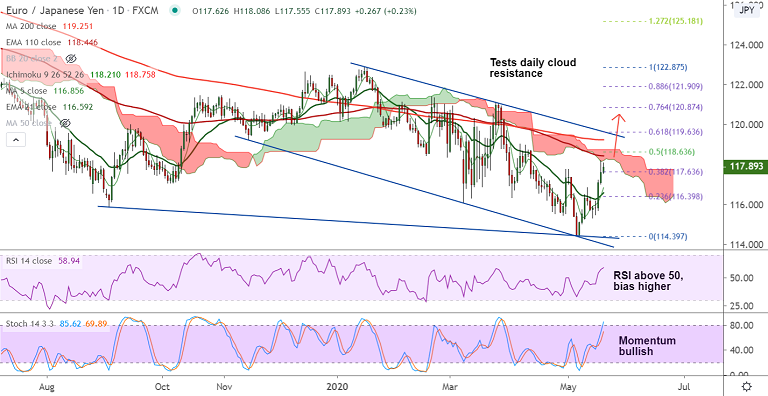
EUR/JPY chart - Trading View
EUR/JPY was trading 0.26% higher on the day at 117.93 at around 05:45 GMT after closing 0.45% higher in the previous session.
The pair is extending a winning streak for the 3rd straight session with scope for further upside.
Technical indicators have turned bullish on the daily charts. RSI has is above 50 and is sharply higher.
Volatility is rising as evidenced by widening Bollinger bands and MACD supports upside.
The pair finds stiff resistance at daily cloud and 110-EMA. Break above eyes 200-DMA at 119.25.
55-EMA is immediate support at 117.44. Retrace below will see dip till 116.59. Break below 21-EMA negates bullish bias.
Support levels - 117.63 (38.2% Fib), 117.44 (55-EMA), 116.59 (21-EMA)
Resistance levels - 118.21 (Cloud base), 118.44 (110-EMA), 119.25 (200-DMA)


