


 FxWirePro : GBP/NZD strongly bearish despite upside attempts
  EURUSD Spikes to 1.14306 on Fed Pause as Traders Eye Sell-the-Rally Setup
  FxWirePro: EUR/ AUD gains some ground , but remains on bearish path
  FxWirePro: USD/ZAR firms ahead of Fed interest rate decision
  FxWirePro: GBP/NZD maintains bersish bias with focus on 2.2900 level
  FxWirePro:EUR/NZD gains some upside momentum but still bearish
  FxWirePro: USD/CAD slips after Fed holds rates steady
  JPY Pairs Action Bias: EURJPY Leads as Bullish Standout Amid Mixed Momentum
  FxWirePro- Major Crypto levels and bias summary
  FxWirePro: USD/ CNY remains soft ahead of Fed decision
  FxWirePro- Woodies pivot (Major)
  FxWirePro- Woodies pivot (Major)
  FxWirePro: GBP/USD edges higher as traders await BoE guidance and UK fiscal clarity
  FxWirePro: USD/JPY eases ahead of Fed decision , Intervention risks linger
  EUR/JPY Holds Bullish Bias as Euro Extends Recovery


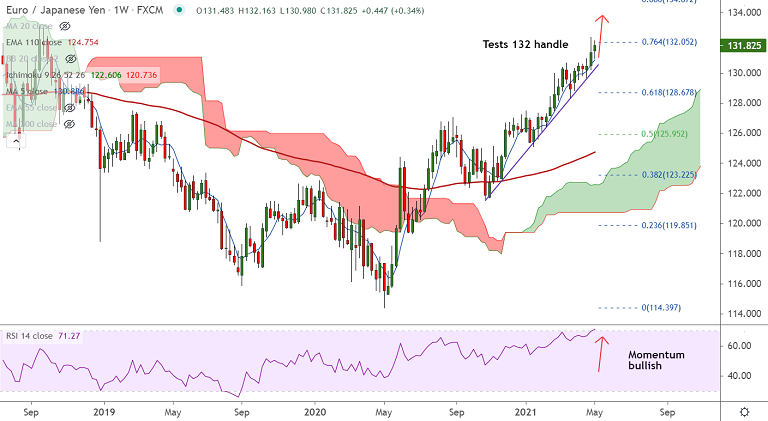
EUR/JPY chart - Trading View
Technical Analysis: Bias Bullish
- GMMA indicator shows major and minor trend are strongly bullish
- Price action is consolidating break above 200-month MA
- Momentum is with the bulls, Stochs and RSI are biased higher
- Volatility is high and rising as evidenced by widening Bollinger bands
- Price action is above daily cloud and major moving averages, Chikou span is biased higher
Support levels - 131.45 (5-DMA), 130.89 (21-EMA), 130.28 (200-month MA)
Resistance levels - 132.05 (76.4% Fib), 132.20 (Upper BB), 133.13 (17th Sept 2018 high)
Summary: EUR/JPY trades with a bullish bias. Price action has tested 76.4% Fib and is consolidating above 200-month MA. Scope for further upside. Gains till 133 mark likely.







