


 FxWirePro: USD/ZAR downside pressure builds, key support level in focus
  FxWirePro: NZD/USD slips ahead of widely expected RBNZ rate hike
  FxWirePro: GBP/AUD uptrend loses steam, remains on bullish path
  FxWirePro: EUR/USD edges higher but rally stalls below post-NFP peak
  FxWirePro- Woodies pivot (Major)
  NZDJPY Poised for Downtrend as Resistance Holds Firm
  FxWirePro: AUD/USD rallies as traders scale back Fed rate hike bets
  FxWirePro: GBP/NZD pulls back slightly , bullish bias persists.
  USDCHF Faces Downside Risk as Resistance Holds; Sell Rallies Recommended
  FxWirePro: USD/ZAR slips as weak U.S. Jobs data weighs on dollar
  FxWirePro- Major Pair levels and bias summary
  FxWirePro- Major Crypto levels and bias summary
  FxWirePro: USD/CAD consolidating around 1.4200 room for further gains
  FxWirePro: AUD/USD slips following softer TD-MI inflation gauge
  FxWirePro USD/JPY rises as dip buyers offset intervention fears
  FxWirePro USD/JPY dips as Yen gains after Japan reaffirms FX intervention readiness


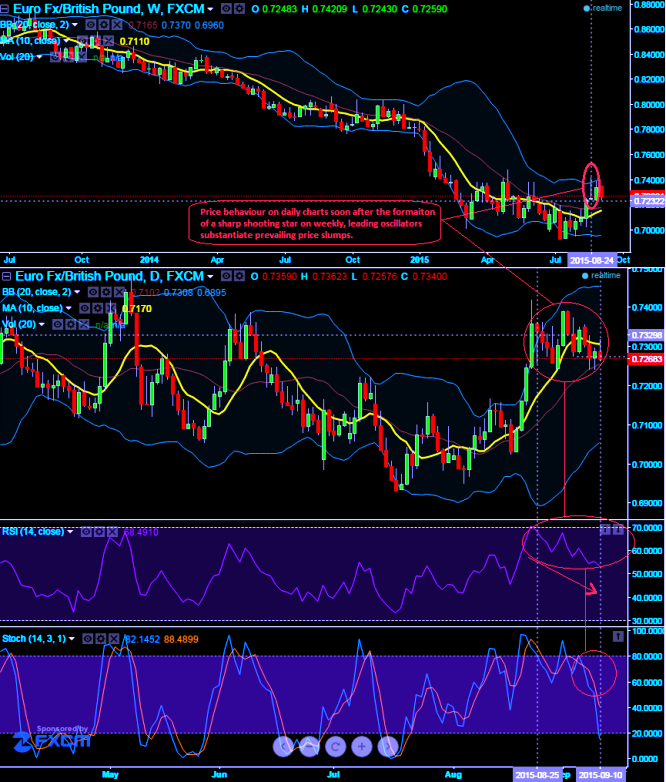
A sharp shooting star pattern candle occurred at 0.7289 on weekly technical charts on 24th of August that is signifying down-streak again now in daily charting. This pair had bounced from 0.7031 (lows of 19th) to 0.7420 levels, that is the time when this bearish pattern formed. Since then you can observe the price actuion on daily chart. The convergence on RSI is seen on daily charts as it is trending near 57.1700 levels with a supportive signal from stochastic curve as %D line crossover above 80 levels which indicates overbought pressure. These signals can be attributed as supportive movers for those who expect price slumps.
As the short term uptrend of EURGBP was quite uncertain, bear put spread was advised over naked protective put as the premiums on naked puts proved too costlier. So, Bear Put Spread still goes this way = Long 1M ATM -0.5 delta Put + Sell 7D another -1.5% OTM Put with net delta should be at around -0.37.
So when you initiate a bear put spread rather than outright purchase of a put, you are limiting your upside potential. If the asset price falls like a rock, then you aren't able to fully participate in that movement because the lower strike price put that you sold will probably be exercised, limiting your gain.
Risk/reward profile: The highest loss for this strategy is limited to extent of the net debit paid for the spread. (i.e. the premium paid for the long position less the premium received for the short position). While the highest profit is limited to the difference between the two strike prices minus the net debit paid for the position.

- News

- Economy

- Central Banks
- Investing
- Research
- Roundups
- Digital Currency
- Insights
- Technical Analysis
- Technology
- Business
- Law
- Health
- Nature
- Fintech
- Science
- Topic
- Opinions
- ©Econometrics LLC . All Rights Reserved.
FxWirePro: EUR/GBP shooting star impacts daily prices – debit put spread still a right choice of speculation
Thursday, September 10, 2015 10:38 AM UTC
Editor's Picks


- Market Data
Most Popular


