


 FxWirePro: USD/ CNY hits one-month low,scope for futher downside
  FxWirePro: USD/JPY eases ahead of Fed decision , Intervention risks linger
  FxWirePro: AUD/USD falls after softer-than-expected Australian Q2 CPI
  Buy the Dips on EUR/JPY: Bullish Structure Points to 188 Target Ahead of Fed
  FxWirePro: USD/CAD slips after Fed holds rates steady
  FxWirePro- Woodies pivot (Major)
  FxWirePro: AUD/USD dips below lower range, bearish bias increases
  FxWirePro: NZD/USD firms as Kiwi gains on strong ANZ business outlook data
  FxWirePro: GBP/NZD maintains bersish bias with focus on 2.2900 level
  FxWirePro: USD/ZAR firms ahead of Fed interest rate decision
  FxWirePro: USD/JPY edges higher as focus shifts to BOJ decision
  JPY Pairs Action Bias: EURJPY Leads as Bullish Standout Amid Mixed Momentum
  FxWirePro : GBP/NZD strongly bearish despite upside attempts
  FxWirePro: USD/ CNY remains soft ahead of Fed decision
  Major Forex Pairs Action Bias: GBPUSD and AUDUSD Turn Extremely Bearish
  JPY Action Bias: EURJPY and CADJPY Emerge as Extremely Bullish Pairs to Watch


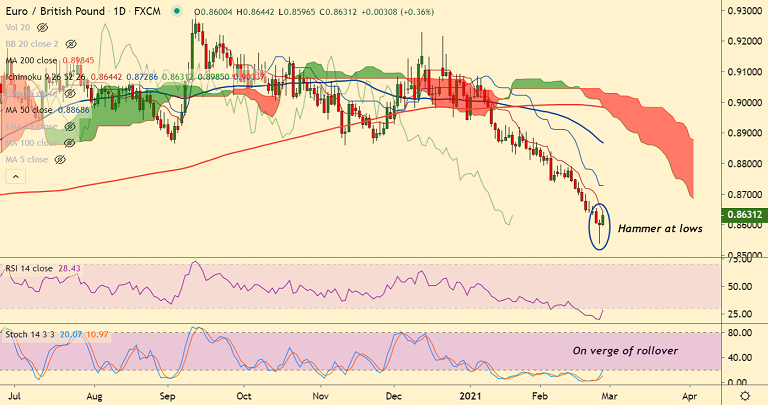
EUR/GBP chart - Trading View
Technical Analysis: Bias Turning Bullish
- EUR/GBP trades 0.40% higher on the day at 0.8634 at 10:50 GMT
- Hammer formation on Previous days candle suggests indecision to drag prices lower
- Price has edged above 5-DMA and 5-DMA is showing a turn
- Stochs and RSI are at highly oversold levels and are on verge of bullish rollover
- GMMA indicator shows near-term MAs have edged above long-term MAs on the hourly charts
Support levels - 0.8626 (5-DMA), 0.8560 (76.8% Fib), 0.8463 (110 month EMA)
Resistance levels - 0.8661 (200H MA), 0.8688 (55 month EMA), 0.8721 (21-EMA)
Summary: EUR/GBP pauses downside at 76.8% Fib. Major trend in the pair is bearish. However, minor signs of reversal seen on intraday charts. Break above 200H MA at 0.8661 could see further gains.


