


 FxWirePro: NZD/USD neutral in the near-term, scope for downward resumption
  NZDJPY Bullish Rebound: Buy Dips as EMAs Align for 97 Target
  FxWirePro: USD/JPY eases ahead of Fed decision , Intervention risks linger
  JPY Action Bias: EURJPY and CADJPY Emerge as Extremely Bullish Pairs to Watch
  FxWirePro- Major Pair levels and bias summary
  EURUSD Spikes to 1.14306 on Fed Pause as Traders Eye Sell-the-Rally Setup
  AUD/JPY Slips Below 112 as BOJ Intervention Sparks Bearish Momentum: Sell the Rallies
  Major FX Action Bias & US Market Sentiment: NZD/USD (Extremely Bullish) & AUD/USD (Bullish) Watchlist
  FxWirePro: AUD/USD falls after softer-than-expected Australian Q2 CPI
  FxWirePro: NZD/USD firms as Kiwi gains on strong ANZ business outlook data
  FxWirePro:EUR/NZD gains some upside momentum but still bearish
  Major Forex Pairs Action Bias: GBPUSD and AUDUSD Turn Extremely Bearish
  FxWirePro: USD/ CNY remains soft ahead of Fed decision
  JPY Pairs Action Bias: EURJPY Leads as Bullish Standout Amid Mixed Momentum
  FxWirePro: GBP/USD edges lower ahead of Fed policy verdict
  FxWirePro: USD/ZAR firms ahead of Fed interest rate decision


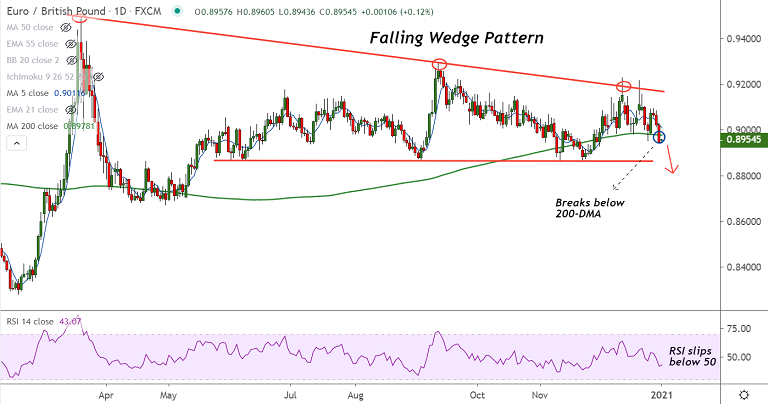
EUR/GBP chart - Trading View
Technical Analysis: Bias Bearish
- EUR/GBP closed below 200-DMA on December 31st trade opening downside
- Volatility is rising as evidenced by widening Bollinger bands
- Price has slipped below daily cloud adding to the downside bias
- Stochs and RSI are strongly bearish, RSI is now below the 50 mark
- Analysis of GMMA indicator shows minor trend has turned bearish
Support levels - 0.8924 (50W MA), 0.8887 (weekly cloud base), 0.8828 (200W MA)
Resistance levels - 0.8978 (200-DMA), 0.9010 (converged 110-EMA and 5-DMA), 0.9021 (55-EMA)
Summary: EUR/GBP shows signs of weakness. Break below 200-DMA has opened downside for the pair. Scope for test of 200W MA at 0.8828.


