


 JPY Action Bias: Bullish Pairs to Watch Out For
  FxWirePro: GBP/AUD under pressure as pound continues to weaken
  FxWirePro: AUD/USD gains on Iran-US truce hopes, risk rally
  AUDJPY Action Bias: Bullish Dip-Buy Setup Despite Flat Neutral Bias
  FxWirePro: USD/CNY dips as yuan firms on improving risk appetite
  AUDJPY Weakness Deepens: Sell Rallies Toward 112 as Aussie Dollar Falters
  FxWirePro: EUR/NZD downside pressure builds, key support level in focus
  FxWirePro: EUR/AUD outlook weaker on renewed downside pressure
  FxWirePro: NZD/USD gains as U.S.-Iran peace hopes boost risk sentiment
  NZDJPY Action Bias: Bullish Dip-Buying Opportunity on Broad Yen Weakness
  FxWirePro: NZD/USD edges lower, remains on back foot
  FxWirePro: EUR/NZD up trend gains momentum but hurdles ahead
  FxWirePro: GBP/AUD downside pressure builds, key support level in focus
  Major Pair Action Bias: Bullish Pairs to Watch Out For
  NZDJPY Pullback: Sell Rallies Toward 93.30 as Yen Weakness Eases
  GBPJPY Slips After Sterling Weakness, Bears Eye 216


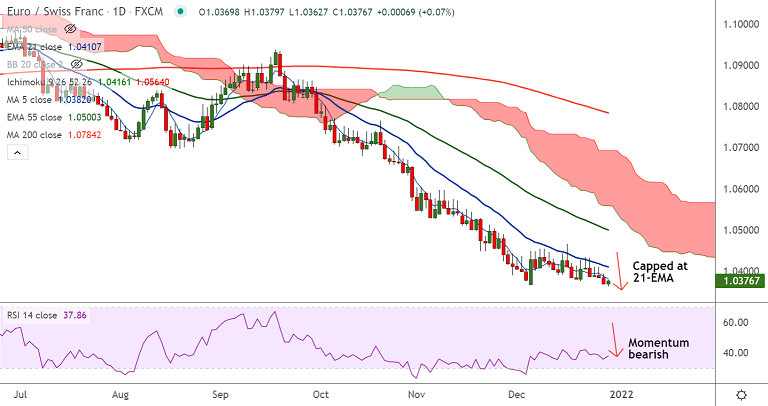
Chart - Courtesy Trading View
Technical Analysis: Bias Bearish
GMMA Indicator
- Major and minor trend are strongly bearish
Ichimoku Analysis
- Price action is well below the daily cloud
- Chikou span is showing a slight upside for the day
Oscillators
- Stochs and RSI show momentum is strongly bearish
- Stochs are at oversold levels, but no signs of reversal seen
Bollinger Bands
- Bollinger bands are starting to widen again after constriction
- Signals higher volatility for the pair ahead
Major Support Levels: 1.0362 (Lower BB), 1.0351 (July 2015 low), 1.0295 (June 2015 low)
Major Resistance Levels: 1.0380 (5-DMA), 1.04, 1.0410 (21-EMA)
Summary: EUR/CHF has tested levels unseen since since July 2015 and is poised for further downside. Bullish RSI divergence on the daily charts along with oversold conditions could see some minor pullbacks.


