


 FxWirePro: GBP/AUD gains some upside momentum but still bearish
  FxWirePro: USD/CAD slips after Fed holds rates steady
  FxWirePro- Major Pair levels and bias summary
  FxWirePro: NZD/USD neutral in the near-term, scope for downward resumption
  FxWirePro: GBP/USD edges higher as traders await BoE guidance and UK fiscal clarity
  NZD/JPY Flatlines Near 94.60: Will Key Support Reignite the Uptrend?
  Buy the Dips on EUR/JPY: Bullish Structure Points to 188 Target Ahead of Fed
  FxWirePro: USD/ZAR firms ahead of Fed interest rate decision
  EURUSD Spikes to 1.14306 on Fed Pause as Traders Eye Sell-the-Rally Setup
  FxWirePro- Woodies pivot (Major)
  FxWirePro: GBP/AUD gains above 1.9200 level , upside pressure builds
  FxWirePro: GBP/NZD maintains bersish bias with focus on 2.2900 level
  JPY Pairs Action Bias: EURJPY Leads as Bullish Standout Amid Mixed Momentum
  FxWirePro- Major Crypto levels and bias summary


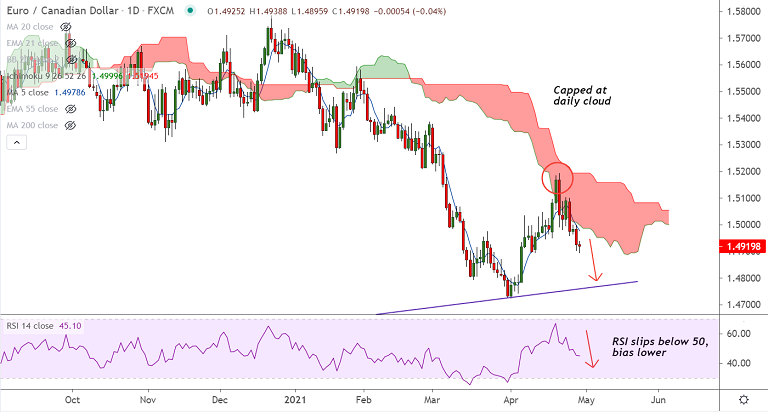
EUR/CAD chart - Trading View
Technical Analysis: Bias Bearish
- Recovery attempts were rejected at daily cloud
- Oscillators are biased lower, RSI has slipped below 50 mark
- GMMA indicator shows major and minor trend are bearish
- Stiff resistance is seen at 1.4975, decisive break above could see some upside
- On the weekly charts the pair has paused 3 straight weeks of gains, 200W MA and weekly cloud cap upside
Support levels - 1.4792 (Lower BB), 1.4765 (trendline), 1.4606 (200-month MA)
Resistance levels - 1.4976 (21-EMA), 1.5033 (200H MA), 1.5050 (55-EMA)
Summary: EUR/CAD was trading 0.09% lower at 1.4912 at around 11:35 GMT. Technical indicators are bearish. Scope for test of trendline support at 1.4765.







