


 FxWirePro- Major Crypto levels and bias summary
  FxWirePro- Major Crypto levels and bias summary
  FxWirePro- Major Crypto levels and bias summary
  FxWirePro- Major Crypto levels and bias summary


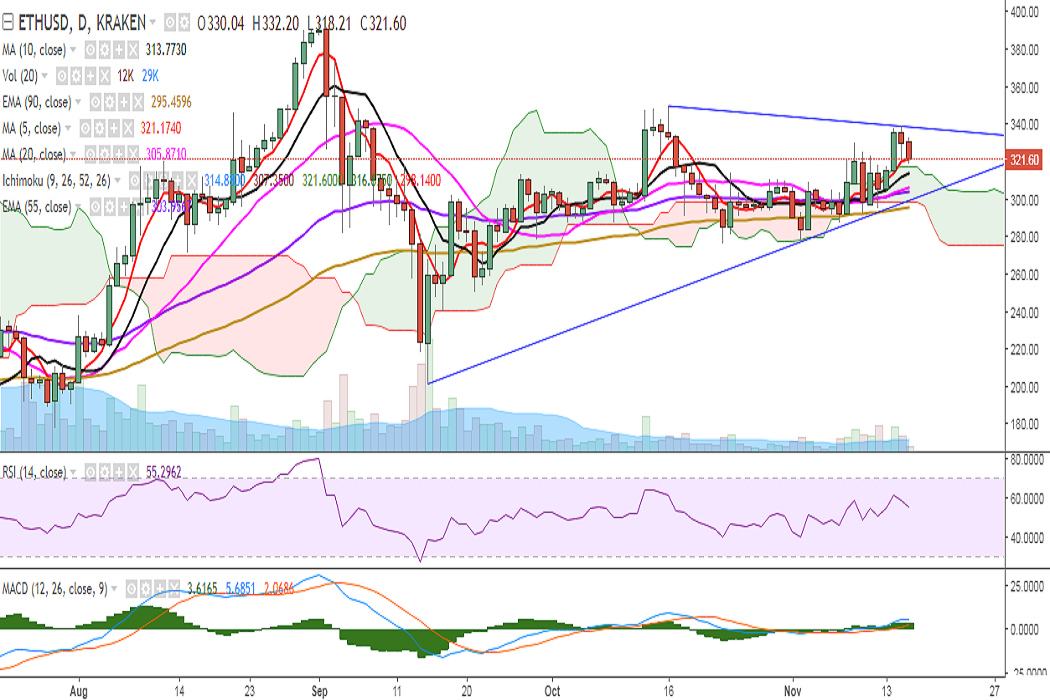
ETH/USD is trading lower on Thursday as it failed to sustain its strength above the trend line joining 404.99 and 395. It is currently trading at 319 levels at the time of writing (Kraken).
Ichimoku analysis (Daily chart):
Tenkan-Sen: 314.88
Kijun-Sen: 307.35
On the upside, the pair faces resistance at 337 (trend line joining 349.50 and 338.70) and a break above would see it testing 345 (August 21 high)/369 (127.2% retracement 349.50 and 277.70). Further strength would target 385 (trend line joining 404.99 and 395)/395 (September 01 high).
On the downside, immediate support is seen at 313 (10-DMA) and any violation would see the pair testing 299 (trend line joining 201 and 277)/277 (November 2 low). Further weakness would drag the pair to 261 (200-DMA).
Momentum studies: On the daily chart, RSI is at 54 and MACD line is above the signal line. The trend line joining 201 and 277 is a major support and a break below, coupled with RSI below 50, would see further bearishness in the pair.
Intraday bias appears bearish on the hourly charts. On the 1h chart, 315 (200-SMA) is a major support and a break below would target 300.
FxWirePro launches Absolute Return Managed Program. For more details, visit http://www.fxwirepro.com/invest

- News

- Economy

- Central Banks
- Investing
- Research
- Roundups
- Digital Currency
- Insights
- Technical Analysis
- Technology
- Business
- Law
- Health
- Nature
- Fintech
- Science
- Topic
- Opinions
- ©Econometrics LLC . All Rights Reserved.
FxWirePro: ETH/USD trades lower, break below trend line support at 299 to see further downside
Thursday, November 16, 2017 10:50 AM UTC
Editor's Picks


- Market Data
Most Popular


3


