


 FxWirePro- Major Crypto levels and bias summary
  FxWirePro- Major Pair levels and bias summary
  FxWirePro- Major Crypto levels and bias summary
  FxWirePro: USD/CNY sees some bounce after yesterday's fall
  FxWirePro: EUR/AUD dips below 1.6200 level ,vulnerable to more downside
  FxWirePro- Major Pair levels and bias summary
  FxWirePro: GBP/NZD gains some upside momentum but still bearish
  FxWirePro: USD/CAD maintains bullish bias with focus on 1.4000


 Add as a preferred source on Google
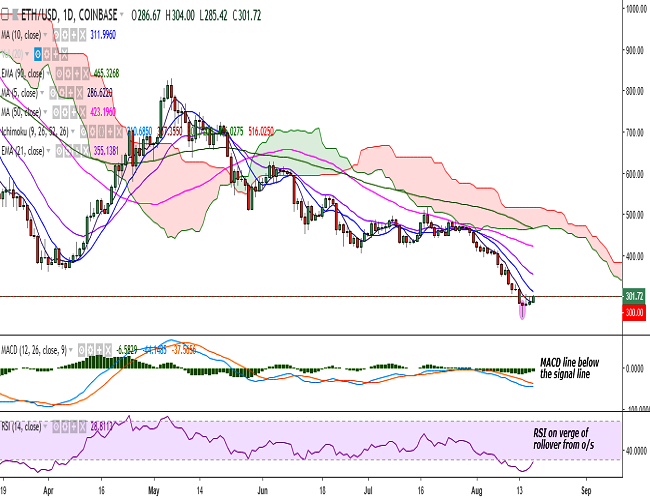
(Refer ETH/USD chart on Trading View)
ETH/USD is trading in the green on Friday just shy of 10-DMA resistance.
It is currently trading at 301 levels at the time of writing (Coinbase).
On the upside, a decisive break above 311 (10-DMA) would see the pair testing 355 (21-EMA)/366 (20-DMA)/386 (23.6% retracement of 828.97 and 250.28)/400.
On the flipside, support is likely to be found at 290 (1h 50-SMA) and a break below would drag it to 250 (August 14 low)/ 237 (113% extension of 828.97 and 305.14)/200.
On the daily chart, RSI and stochs are on the verge of a rollover from oversold levels. The hammer pattern suggests scope for further upside.
A close above 10-DMA would see minor bullishness in the pair.

- News

- Economy

- Central Banks
- Investing
- Research
- Roundups
- Digital Currency
- Insights
- Technical Analysis
- Technology
- Business
- Law
- Health
- Nature
- Fintech
- Science
- Topic
- Opinions
- ©Econometrics LLC . All Rights Reserved.
FxWirePro: ETH/USD tests key resistance at 300, close above 10-DMA to see further bullishness
Friday, August 17, 2018 10:17 AM UTC
Editor's Picks



- Market Data
Most Popular




