


 FxWirePro- Major Crypto levels and bias summary
  Ethereum Cracks Under $1,700: Sell the Rally Near $1,750 as Bears Eye $1,380–$1,200
  FxWirePro- Major Crypto levels and bias summary


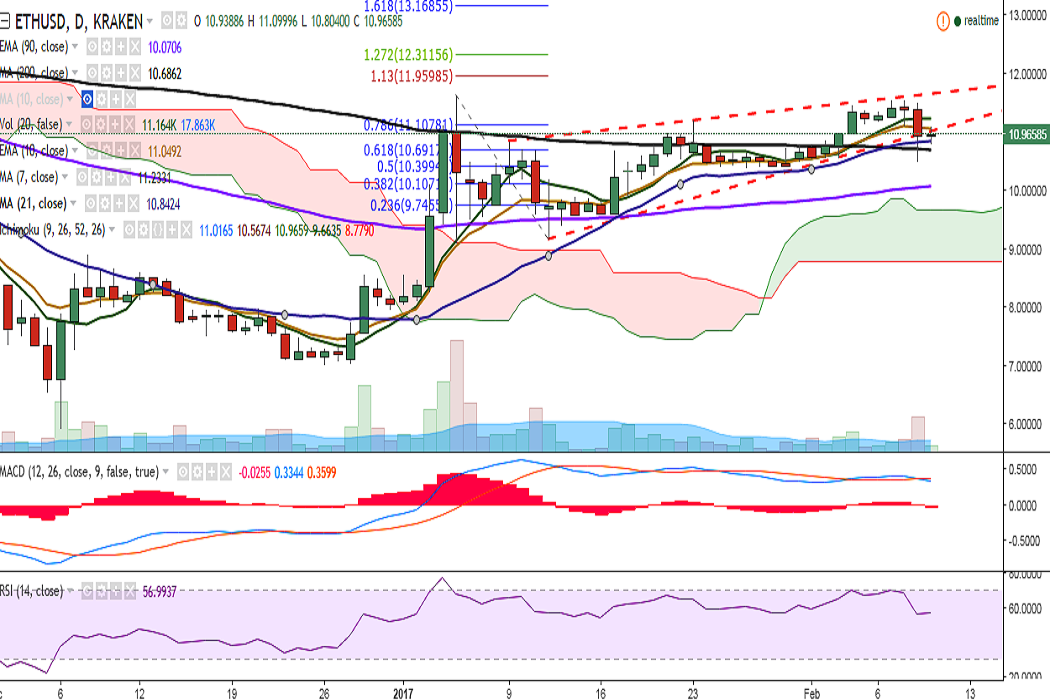
ETH/USD fell to a low of 10.48 levels on Thursday mirroring the weakness in bitcoin price. It is trading at 10.94 levels at press time (Kraken).
Ichimoku analysis (Daily chart):
Tenkan-Sen: 11
Kijun-Sen: 10.56
In daily charts, the pair is trading rangebound today, taking support near 10.82 levels (21-DMA). The current dogi formation suggests market indecisiveness. A consistent break below 21-DMA is expected to see further weakness, targeting 10.70 (200-DMA)/10.48 (February 9 low)/10.
Momentum studies suggest bearish bias, as stochs point south, bearish crossover of MACD. RSI is flatlined for the day at 56, and a drop below 50 would confirm bearish bias.
The pair is facing resistance at 11 (10-EMA) and a break above would see it testing 11.23 (7-DMA)/11.54 (February 07 high).

- News

- Economy

- Central Banks
- Investing
- Research
- Roundups
- Digital Currency
- Insights
- Technical Analysis
- Technology
- Business
- Law
- Health
- Nature
- Fintech
- Science
- Topic
- Opinions
- ©Econometrics LLC . All Rights Reserved.
FxWirePro: ETH/USD takes support near 21-DMA, good to go short below 10.70
Friday, February 10, 2017 11:04 AM UTC
Editor's Picks


- Market Data
Most Popular


