


 FxWirePro- Major Crypto levels and bias summary
  FxWirePro- Major Crypto levels and bias summary


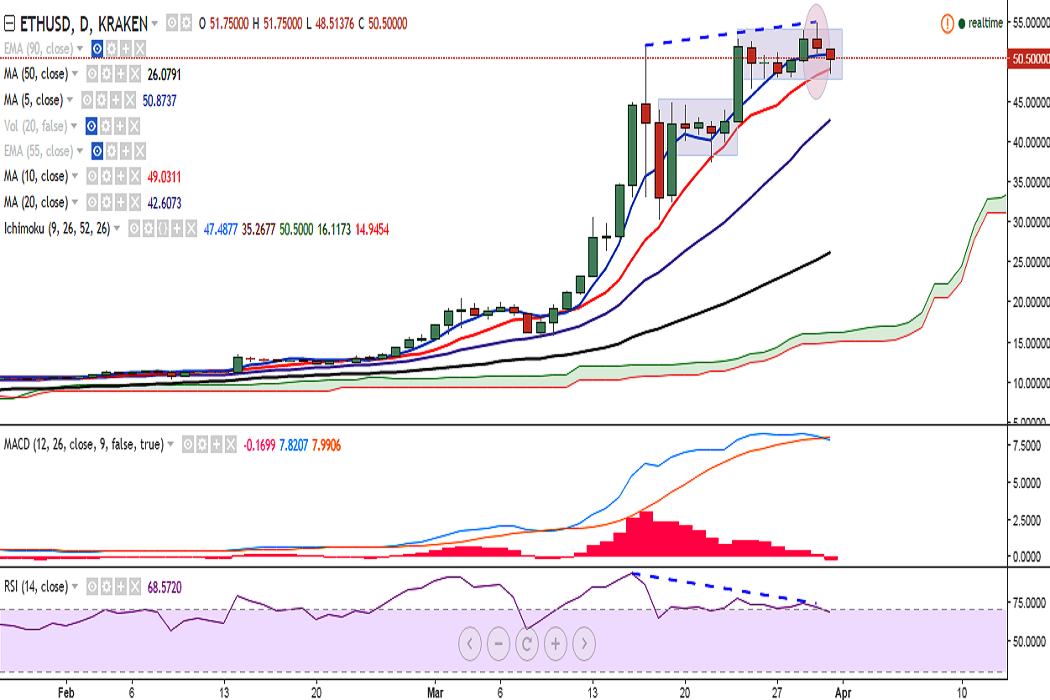
ETH/USD is trading in the red after it hit a fresh all-time high at 54.97 on Thursday. It is currently at 50 levels at the time of writing (Kraken).
Ichimoku analysis (Daily chart):
Tenkan-Sen: 47.48
Kijun-Sen: 35.26
The pair has formed a bullish flag pattern, with upside capped by 55.43 (200% extension of 5.92 and 30.67 rally). A consistent break above would see it testing 57.87(113% extension of 5.92 and 51.90)/60.
Also, a shooting star could be seen on the daily charts, suggesting downside momentum. In addition, bearish RSI divergence along with its rolling over from overbought zone, a bearish MACD crossover, and stochs in the overbought zone, suggest that we could see some bearishness in the pair.
The pair has broken below 50.79 (5-DMA) and taken support near 49.06 (10-DMA). A close below this level could see minor bearishness in the pair, dragging it till 42.62 (20-DMA)/ 37.60 (March 22 low).

- News

- Economy

- Central Banks
- Investing
- Research
- Roundups
- Digital Currency
- Insights
- Technical Analysis
- Technology
- Business
- Law
- Health
- Nature
- Fintech
- Science
- Topic
- Opinions
- ©Econometrics LLC . All Rights Reserved.
FxWirePro: ETH/USD takes support near 10-DMA, close below to see minor bearishness
Friday, March 31, 2017 9:25 AM UTC
Editor's Picks


- Market Data
Most Popular


