


 FxWirePro- Major Crypto levels and bias summary
  BTC’s Bear Bounce: Sell the Rally Near $66K as Bears Target $59K–$52K Breakdown
  Ethereum Cracks Under $1,700: Sell the Rally Near $1,750 as Bears Eye $1,380–$1,200


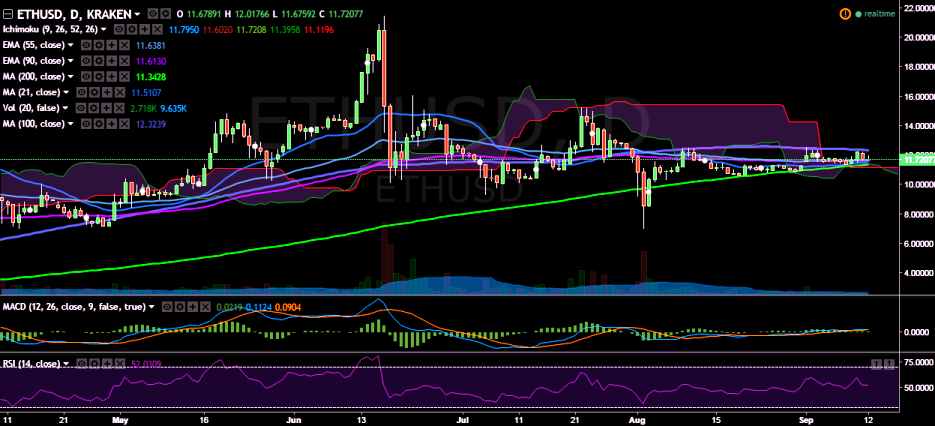
ETH/USD once again failed to break above 100-day MA and has declined after hitting 12.24 levels. Taking support at 90 EMA, the pair is currently trading at 11.84 levels (Kraken).
Ichimoku analysis of daily chart:
Tenkan Sen: 11.86
Kijun Sen: 11.60
Trend reversal: 11.61 (90 EMA)
Major resistance is seen at 12.34 (100-day MA) and a break above would see the pair testing13.47 (78.6% retracement of 15.23 and 7.00)/ 15.23 (July 22 high).
On the reverse side, support is seen at 11.61 (90 EMA) and a break below would target 11.31 (200-day MA)/10.00 (psychological level) and then to 9.77(50% retracement of 7 and 12.54).

- News

- Economy

- Central Banks
- Investing
- Research
- Roundups
- Digital Currency
- Insights
- Technical Analysis
- Technology
- Business
- Law
- Health
- Nature
- Fintech
- Science
- Topic
- Opinions
- ©Econometrics LLC . All Rights Reserved.
FxWirePro: ETH/USD struggles to close above 100-day MA, good to sell on rallies
Monday, September 12, 2016 11:26 AM UTC
Editor's Picks


- Market Data
Most Popular


