


 FxWirePro- Major Crypto levels and bias summary
  FxWirePro- Major Crypto levels and bias summary
  FxWirePro- Major Crypto levels and bias summary
  BTC’s Bear Bounce: Sell the Rally Near $66K as Bears Target $59K–$52K Breakdown


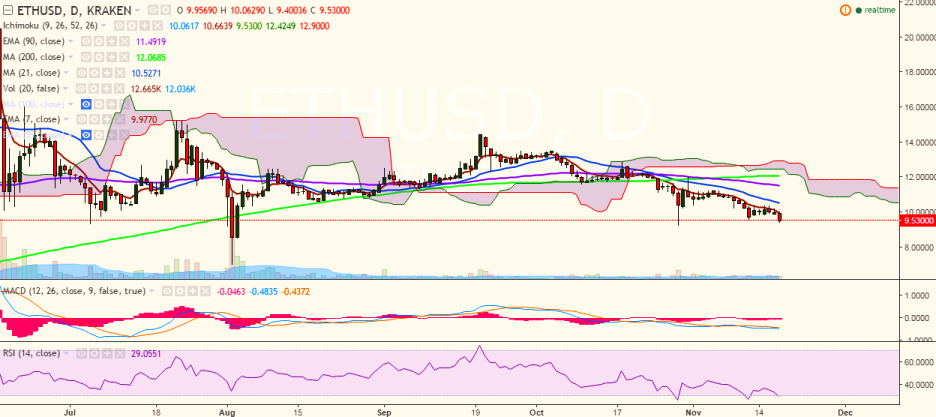
ETH/USD has declined sharply after it hit 10.37 levels and fell to 9.40 levels on Friday. It is currently trading at 9.53 levels (Kraken).
Ichimoku analysis (Daily chart):
Tenkan-Sen: 10.21
Kijun-Sen: 10.75
Trend reversal: 11.53 (90 EMA)
The pair has failed to break above 10.23 (10-day MA) and only a consistent break above would see the pair testing 10.67 (21 EMA)/11.0 (61.8% retracement of 12 and 9.40). Bullishness in the pair could be confirmed only if it breaks above 12.00 levels (October 31 high).
On the downside, support is seen at 9.23 (Oct 29 low) and a break below would drag it to 8.86 (113% retracement of 9.23 and 12)/8.59 (78.6% retracement of 7 and 14.45).

- News

- Economy

- Central Banks
- Investing
- Research
- Roundups
- Digital Currency
- Insights
- Technical Analysis
- Technology
- Business
- Law
- Health
- Nature
- Fintech
- Science
- Topic
- Opinions
- ©Econometrics LLC . All Rights Reserved.
FxWirePro: ETH/USD struggles to break above 10-DMA, good to sell on rallies
Friday, November 18, 2016 11:36 AM UTC
Editor's Picks


- Market Data
Most Popular


