


 ETH Bounces as Shorts Cover, Yet ETF Bleed Warns $1,850 Resistance Won’t Break
  Bitcoin Pulls Back Amidst Geopolitical Tensions and ETF Outflows, Technicals Signal Caution
  FxWirePro- Major Crypto levels and bias summary
  FxWirePro- Major Crypto levels and bias summary


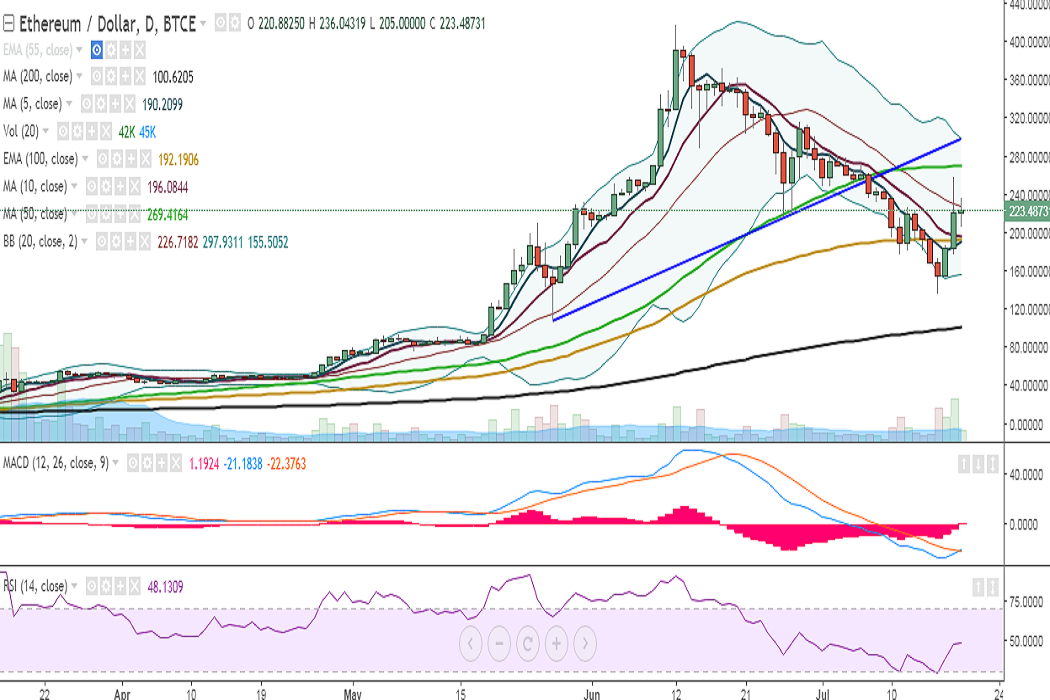
ETH/USD hit 257 levels on Tuesday but failed to close above 20-DMA. It continues to struggle for a decisive break above this level and is trading at 225 levels at the time of writing (BTC-e).
Ichimoku analysis (Daily chart):
Tenkan-Sen: 196.23
Kijun-Sen: 230.81
On the upside, a close above 226 (20-DMA) would see the pair testing 269 (50-DMA)/300 (trend line joining 107.06 and 216.51). Further strength would see it testing 315 (June 28 high)/356 (78.6% retracement of 417 and 134.62).
On the downside, support is seen at 196 (10-DMA) and any violation would drag it to 179 (100-DMA)/134 (July 17 low). Further weakness would see the pair testing 107 (May 27 low)/100 (200-DMA)/66 (113% retracement of 107.06 and 417).
Momentum studies: On the daily chart, MACD is on the verge of a bullish crossover and stochs are biased higher. However, RSI is below 50 at 48.
Bias appears neutral on the 4-hour chart as MACD is biased higher, while Stochs have rolled over from the overbought zone.
On the weekly chart, RSI is strong at 60 while stochs are biased lower.
Recommendation: Wait for a clear directional bias.
FxWirePro launches Absolute Return Managed Program. For more details, visit http://www.fxwirepro.com/invest

- News

- Economy

- Central Banks
- Investing
- Research
- Roundups
- Digital Currency
- Insights
- Technical Analysis
- Technology
- Business
- Law
- Health
- Nature
- Fintech
- Science
- Topic
- Opinions
- ©Econometrics LLC . All Rights Reserved.
FxWirePro: ETH/USD hovers around 20-DMA, close above targets 269
Wednesday, July 19, 2017 11:36 AM UTC
Editor's Picks


- Market Data
Most Popular


9


