


 FxWirePro- Major Crypto levels and bias summary
  FxWirePro- Major Crypto levels and bias summary


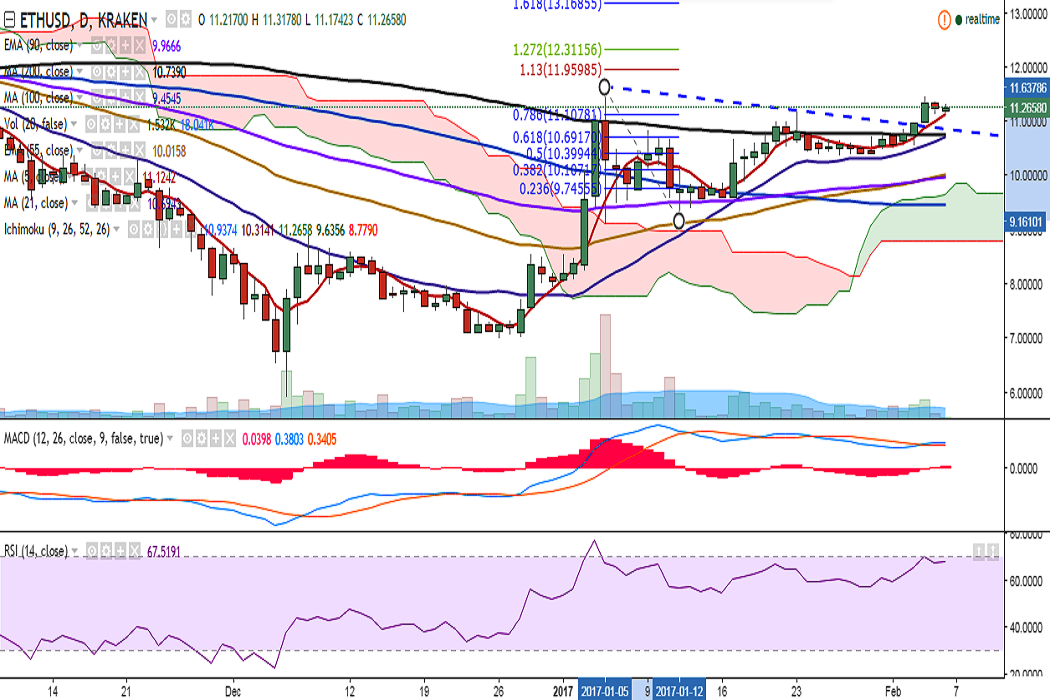
ETH/USD broke above the trend line joining 11.63 and 11.19, thereby breaching the 11.00 mark on February 04 and hit a high of 11.46 levels. The pair is showing a slight dip and is currently trading at 11.26 levels (Kraken).
Ichimoku analysis (Daily chart):
Tenkan-Sen: 10.93
Kijun-Sen: 10.31
On the upside, the pair faces immediate resistance at 11.46 levels (February 04 high) and a break above would target 11.63 (January 05 high)/11.95 (78.6% retracement of 11.63 and 9.19).
Momentum studies suggest bullish trend for the pair: RSI(14) is at 67, bias higher; MACD line is above signal line. The pair has broken major trend line resistance as well as 200-DMA and is holding above 5-DMA.
On the flip side, the pair is likely to find support near 10.98 (5-DMA) and any violation would drag it to 10.74 (200-DMA)/10.61 (21-DMA).

- News

- Economy

- Central Banks
- Investing
- Research
- Roundups
- Digital Currency
- Insights
- Technical Analysis
- Technology
- Business
- Law
- Health
- Nature
- Fintech
- Science
- Topic
- Opinions
- ©Econometrics LLC . All Rights Reserved.
FxWirePro: ETH/USD holding above 5-DMA, stay long
Monday, February 6, 2017 10:38 AM UTC
Editor's Picks


- Market Data
Most Popular


