


 FxWirePro- Major Crypto levels and bias summary
  FxWirePro- Major Crypto levels and bias summary
  FxWirePro: NZD/USD gains as hawkish RBNZ comments boost Kiwi dollar
  FxWirePro- Major Crypto levels and bias summary
  FxWirePro: USD/JPY edges higher but bulls lack punch
  Aussie Yen Breaks 114 Barrier: Bulls Lock Horns With Resistance, Eyes on 115 Summit
  ETH Cracks $2,100 in Bitcoin’s Wake as Bearish EMA Stack Deepens; Sellers Target $1,900 on Rallies
  Ethereum Tumbles Below $2K: Bears Eye $1,700 as All Key EMAs Flip Red


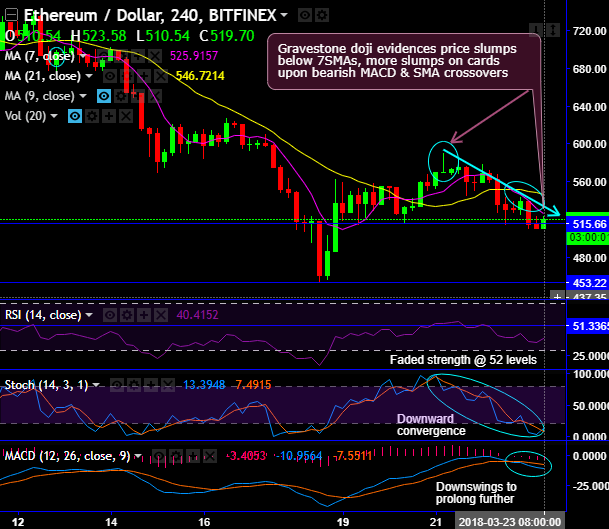
ETHUSD forms gravestone doji pattern candlestick on intraday plotting at 570.03 levels, consequently, this bearish pattern evidences price slumps below 7SMAs, more slumps on cards upon bearish MACD & SMA crossovers (refer 4H chart).
As a result, Ether’s price tumbled recently as it failed to hold the $638.11 and $550.00 levels against the US dollar.
Most importantly, the bearish patterns have hampered the previous bullish sentiments.
On the flip side, the hammer pattern has occurred on daily plotting at $536.73 levels to counter the price slumps.
But we couldn’t foresee further gains above the $585-590 levels in ETH price against USD.
The downtrend has constantly slid below 7EMAs (on the daily chart) which is on the verge of hitting 3-months lows, both leading & lagging indicators signal weakness on this timeframe.
Both leading oscillators (RSI & stochastic curves) show downward convergence to signal strength and momentum in the bearish trend.
To substantiate this stance, MACD has also shown bearish crossover to indicate downtrend to prolong further,
Well, for now, further price dips are likely only on break-below strong support at 638.11 levels
Hence, contemplating above technical rationale, one can think of shorting etherium against the dollar by snapping deceptive rallies below 638 on trading terms.
Currency Strength Index: FxWirePro’s hourly USD spot index has shown -128 (which is highly bearish) while articulating (at 09:56 GMT), for more details on the index, please refer below weblink:
http://www.fxwirepro.com/currencyindex.
FxWirePro launches Absolute Return Managed Program. For more details, visit:


