


 FxWirePro- Major Crypto levels and bias summary
  FxWirePro- Major Crypto levels and bias summary
  Ethereum Cracks Under $1,700: Sell the Rally Near $1,750 as Bears Eye $1,380–$1,200
  BTC’s Bear Bounce: Sell the Rally Near $66K as Bears Target $59K–$52K Breakdown
  FxWirePro- Major Crypto levels and bias summary


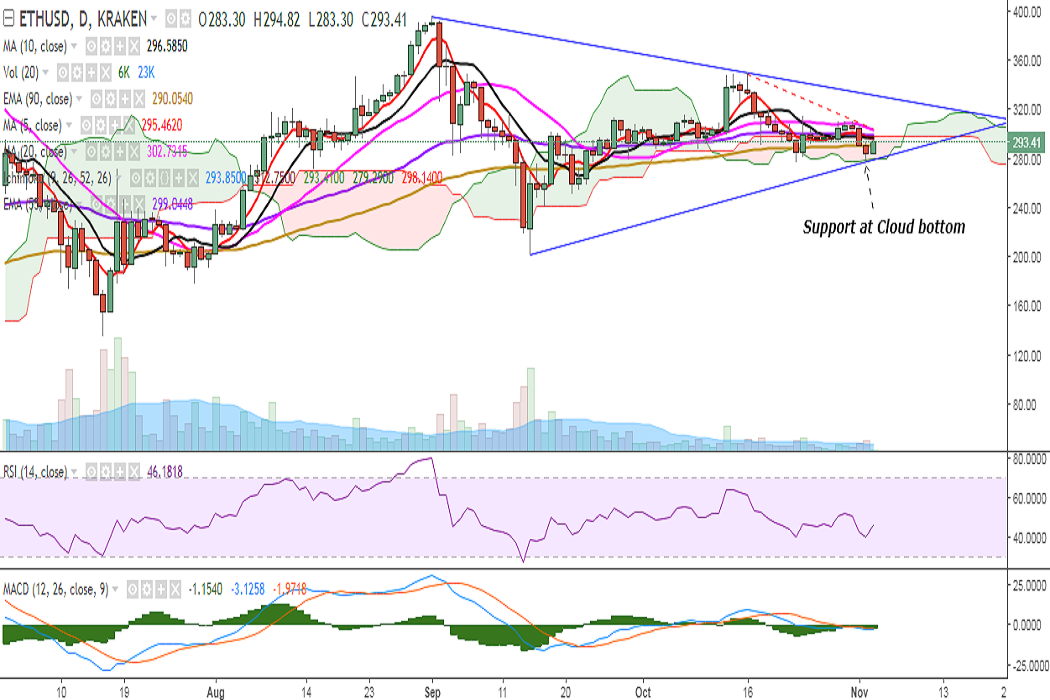
ETH/USD reversed its losses on Friday as it found strong support near Cloud bottom. It is currently trading at 292 levels at the time of writing (Kraken).
Ichimoku analysis (Daily chart):
Tenkan-Sen: 293.85
Kijun-Sen: 312.75
On the upside, immediate resistance is seen at 296 (10-DMA) and a break above would target 302 (convergence of 20-DMA and trend line joining 349.50 and 310)/ 321 (61.8% retracement of 395 and 201.28)/331 (trend line joining 395 and 349.50). Further strength would see it testing 349 (October 16 high)/369/395 (September 01 high).
On the downside side, a break below 279 (Cloud bottom) would drag the pair to 257 (61.8% retracement of 201.28 and 349.50)/245 (200-DMA). Further weakness would see it testing 233/201 (September 15 low).
Momentum studies: On the daily chart, RSI is at 46 and MACD line is below the signal line suggesting bearish bias.
On the weekly chart, RSI is holding above 50, while stochs and MACD suggest bearish bias. The pair has found strong support near 20-SMA and a break below will see further downside.
However, intraday bias appears bullish. On the 2-hour chart, stochs are biased higher, MACD line is above the signal line, and RSI is at 53.
Overall, a break above trend line resistance, coupled with RSI breaking above the 50-mark, is likely to see a jump till 331.
FxWirePro launches Absolute Return Managed Program. For more details, visit http://www.fxwirepro.com/invest

- News

- Economy

- Central Banks
- Investing
- Research
- Roundups
- Digital Currency
- Insights
- Technical Analysis
- Technology
- Business
- Law
- Health
- Nature
- Fintech
- Science
- Topic
- Opinions
- ©Econometrics LLC . All Rights Reserved.
FxWirePro: ETH/USD finds support near Cloud bottom, break above 20-DMA targets 331
Friday, November 3, 2017 8:49 AM UTC
Editor's Picks


- Market Data
Most Popular


3


