


 FxWirePro- Major Crypto levels and bias summary
  Ethereum Cracks Under $1,700: Sell the Rally Near $1,750 as Bears Eye $1,380–$1,200
  FxWirePro- Major Crypto levels and bias summary
  FxWirePro- Major Crypto levels and bias summary


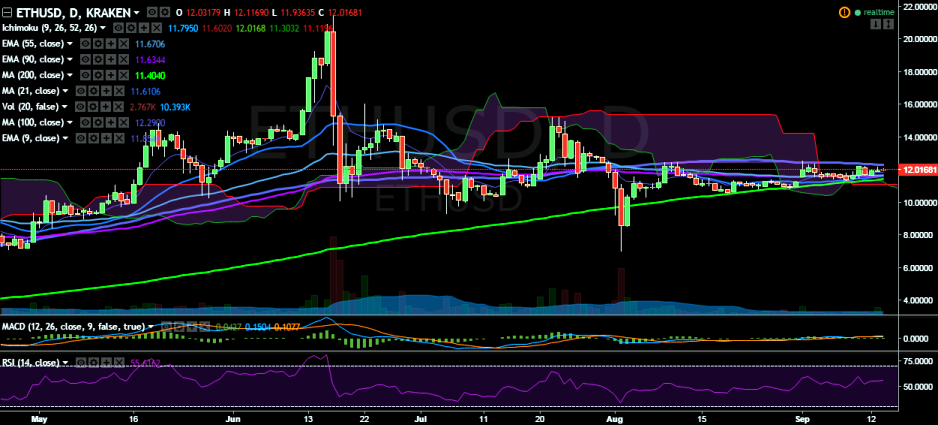
ETH/USD continues to trade below the 100-day MA. It hit 12.19 levels on Tuesday and is currently trading at 12.05 levels, trying to hold above 9-EMA (Kraken).
Ichimoku analysis of daily chart:
Tenkan Sen: 11.79
Kijun Sen: 11.60
Trend reversal: 11.62 (90 EMA)
On the top side, the pair will run into resistance at 12.30 (100-day MA) and a break above would target 13.47 (78.6% retracement of 15.23 and 7.00)/ 15.23 (July 22 high). Further bullishness could be confirmed only if it breaks above previous high of 12.54 (September 01 high).
On the reverse side, support is seen at 11.62 (90 EMA) and any violation would drag the pair 11.37 (200-day MA)/10.00 (psychological level) and then to 9.77(50% retracement of 7 and 12.54).

- News

- Economy

- Central Banks
- Investing
- Research
- Roundups
- Digital Currency
- Insights
- Technical Analysis
- Technology
- Business
- Law
- Health
- Nature
- Fintech
- Science
- Topic
- Opinions
- ©Econometrics LLC . All Rights Reserved.
FxWirePro: ETH/USD faces strong resistance at 100-DMA, good to sell on rallies
Wednesday, September 14, 2016 11:17 AM UTC
Editor's Picks


- Market Data
Most Popular


