


 FxWirePro- Major Crypto levels and bias summary
  FxWirePro- Major Crypto levels and bias summary
  BTC’s Bear Bounce: Sell the Rally Near $66K as Bears Target $59K–$52K Breakdown
  FxWirePro- Major Crypto levels and bias summary
  Ethereum Cracks Under $1,700: Sell the Rally Near $1,750 as Bears Eye $1,380–$1,200


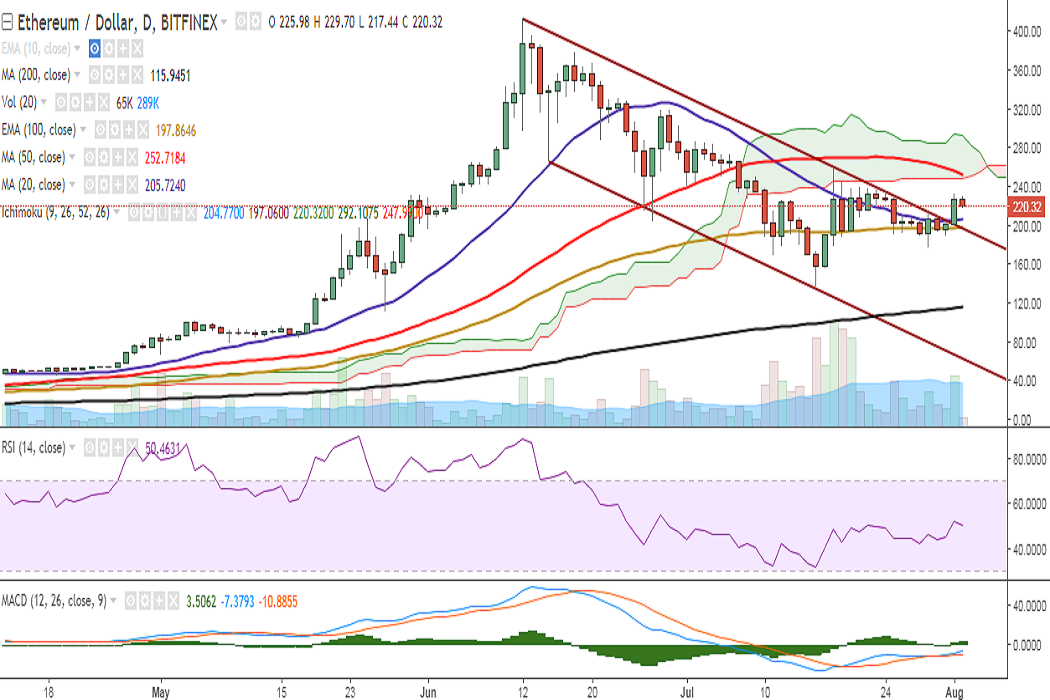
ETH/USD successfully closed above 55-EMA on Tuesday at 225 levels after it breached channel top. It is currently trading at 219 levels at the time of writing (Bitfinex).
Ichimoku analysis (Daily chart):
Tenkan-Sen: 204.77
Kijun-Sen: 197.06
On the upside, a close above 221 (55-EMA) would see the pair targeting 252 (50-DMA)/ 292 (Cloud top)/306 (61.8% retracement of 412.21 and 136.12). Further strength would see it testing 353/377 (June 18 high)/412 (June 12 high).
On the reverse side, support is seen at 204 (100-DMA) and a break below would drag it to 189 (trend line joining 136.12 and 176.95)/166 (1w 20-SMA). Further weakness would drag it to 136 (July 16 low)/115 (200-DMA).
Momentum studies: On the daily chart, MACD line is above the signal line, RSI is at 50, and stochs are biased higher. Moreover, the breach of channel top and the pair holding above 100-DMA suggest bullish bias.
However, weakness could be seen on hourly charts.
On the weekly chart, RSI is at 58 and stochs suggest slightly bullish bias. The pair is also holding above 5-SMA at press time.
Recommendation: Good to go long on dips around 215/220. SL: 189. TP: 252/292.
FxWirePro launches Absolute Return Managed Program. For more details, visit http://www.fxwirepro.com/invest

- News

- Economy

- Central Banks
- Investing
- Research
- Roundups
- Digital Currency
- Insights
- Technical Analysis
- Technology
- Business
- Law
- Health
- Nature
- Fintech
- Science
- Topic
- Opinions
- ©Econometrics LLC . All Rights Reserved.
FxWirePro: ETH/USD consolidates channel breakout, good to go long on dips
Wednesday, August 2, 2017 11:39 AM UTC
Editor's Picks


- Market Data
Most Popular


