


 FxWirePro: NZD/USD downside pressure builds, key support level in focus
  Bank of America Posts Strong Q4 2024 Results, Shares Rise
  Gold Prices Slide as Rate Cut Prospects Diminish; Copper Gains on China Stimulus Hopes
  FxWirePro: AUD/USD eases after Australian mixed CPI data
  FxWirePro- Woodies pivot (Major)
  Stock Futures Dip as Investors Await Key Payrolls Data
  2025 Market Outlook: Key January Events to Watch
  FxWirePro: AUD/USD climbs as US-Iran peace deal sparks risk rally
  Moldova Criticizes Russia Amid Transdniestria Energy Crisis
  Geopolitical Easing Fuels AUDJPY Rally Toward 115 — Buy Dips at 113
  Trump’s "Shock and Awe" Agenda: Executive Orders from Day One
  Lithium Market Poised for Recovery Amid Supply Cuts and Rising Demand
  Indonesia Surprises Markets with Interest Rate Cut Amid Currency Pressure
  U.S. Treasury Yields Expected to Decline Amid Cooling Economic Pressures
  European Stocks Rally on Chinese Growth and Mining Merger Speculation
  China’s Growth Faces Structural Challenges Amid Doubts Over Data


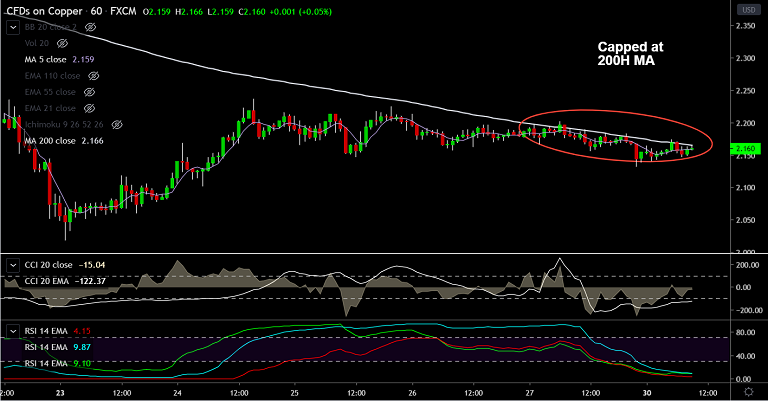
Copper chart - Trading View
Copper is extending weakness for the 3rd straight session, intraday bias remains neutral.
The pair has failed to extend bounce from over 3-year lows, finds stiff resistance at 200H MA at 2.165.
Copper was trading 0.32% lower on the day at 2.161 at around 10:00 GMT, after closing 0.65% lower on Friday's trade.
'Death Cross' (bearish 50-DMA crossover on 200-DMA) likely caps upside in the pair.
Major trend is strongly bearish and minor trend has again turned bearish on the GMMA indicator.
5-DMA is still biased higher. Breakout at 200H MA could see upside continuation. Test of 21-EMA 2.312 then likely.
On the flipside, rejection at 200H MA eyes immediate support at 88.6% Fib at 2.094 ahead of 1.970 (Mar 19 low).
Support levels - 2.094 (88.6% Fib), 1.970 (Mar 19 low)
Resistance levels - 2.165 (200H MA), 2.184 (5-DMA)


