


 JPY Action Bias: EURJPY and CADJPY Emerge as Extremely Bullish Pairs to Watch
  NZDJPY Bullish Rebound: Buy Dips as EMAs Align for 97 Target
  Major FX Action Bias & US Market Sentiment: NZD/USD (Extremely Bullish) & AUD/USD (Bullish) Watchlist
  FxWirePro : GBP/NZD strongly bearish despite upside attempts
  FxWirePro: GBP/USD edges lower ahead of Fed policy verdict
  FxWirePro- Major Crypto levels and bias summary
  FxWirePro: USD/ CNY hits one-month low,scope for futher downside
  FxWirePro: USD/CAD slips after Fed holds rates steady
  FxWirePro- Woodies pivot (Major)
  NZD/JPY Flatlines Near 94.60: Will Key Support Reignite the Uptrend?
  FxWirePro: USD/ZAR firms ahead of Fed interest rate decision
  FxWirePro: GBP/USD rises as soft US data pressures dollar
  EURUSD Spikes to 1.14306 on Fed Pause as Traders Eye Sell-the-Rally Setup
  FxWirePro- Major Pair levels and bias summary
  FxWirePro- Major Crypto levels and bias summary
  FxWirePro: GBP/AUD gains above 1.9200 level , upside pressure builds


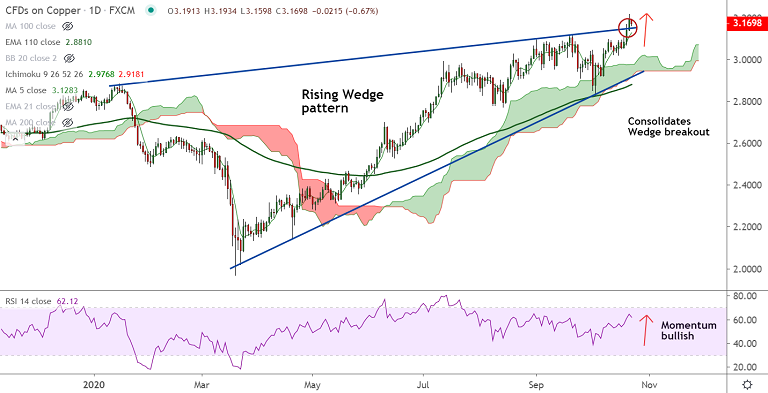
COPPER chart - Trading View
Copper was trading 0.72% lower on the day at 3.168 at around 10:50 GMT, bias still bullish.
Price action is consolidating breakout above 'Rising Wedge' pattern, momentum still with the bulls.
The price of copper has hit fresh multi-month highs (3.216), levels unseen since July 2018 on Wednesday's trade.
Volatility is rising as evidenced by widening Bollinger bands. GMMA indicator shows major and minor trend are strongly bullish.
Price action is above major moving averages and daily cloud offers strong support in case of minor pullbacks.
Momentum indicators are bullish. RSI is above 60 mark and supports uptrend. CCI also supports upside.
Pair finds little resistance on the upside. Scope for test of 3.31 levels. Bullish invalidation only below daily cloud.


