


 Best Gold Stocks to Buy Now: AABB, GOLD, GDX
  FxWirePro: Daily Commodity Tracker - 21st March, 2022
  Gold Prices Fall Amid Rate Jitters; Copper Steady as China Stimulus Eyed


 - EconoTimes)


Background:
Understanding commodities are vital to gauge the performance of other asset classes such as bonds, equities, and even currencies. Since, 2014, any regular follower of financial markets would be able to recall how devastating the drop in oil prices has been for many countries like Russia, Brazil, Mexico, and Malaysia whereas net importers of oil like India has largely benefitted from it. Hence, it is of utmost importance to investors to keep a tab on the trends in the commodities market.
We, at FxWirePro, have been sensing a change in tide in the commodities market. After months and years of battering by traders and investors, since 2016, they are once again becoming the darlings. Many of the commodities have risen more than 40 percent last year and that figure in most cases will be much larger if we consider it from the bottom, which was largely made in early 2016. A more than 20 percent rise from bottom technically indicates a change in the trend.
In this commodities watch, we present to our readers, the performance of commodities, which in turn decide the wellbeing of many commodity producing and consuming nations. For example, China is a major consumer of soybeans, so if the price goes higher, it may drag the country’s trade balance as it imports most of its consumption.
Key
Producers and Consumers:
Biggest producers:
- Ethanol – U.S. and Brazil together produce 85 percent of global ethanol.
- Brent Crude – Saudi Arabia, United States, Russia, Iraq, Iran, Venezuela, UAE, and Kuwait
- WTI Crude – Saudi Arabia, United States, Russia, Iraq, Iran, Venezuela, UAE, and Kuwait
- Natural gas – United States, Qatar, Russia, Australia
Biggest Consumers:
- Ethanol – United States, Brazil, and EU
- Brent Crude – United States, EU, China, India
- WTI Crude – United States, EU, China, India
- Natural gas – United States, EU, China, and Japan
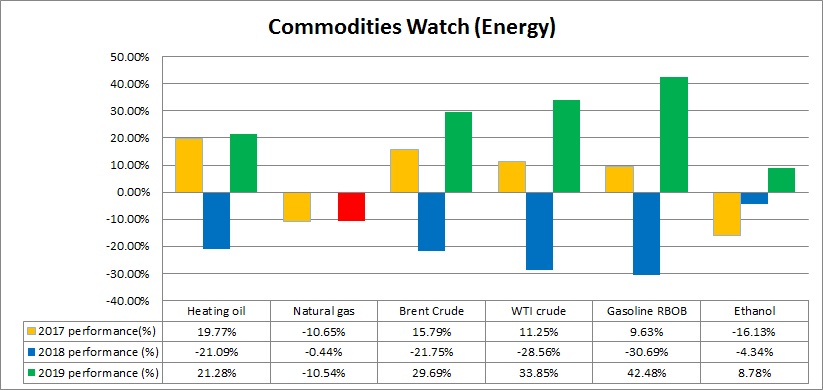
2017 performance:
- The best performer of the group was Heating oil, which was up 19.8 percent in 2017, followed by Brent crude (+15.8 percent), WTI crude (+11.2 percent), and Gasoline (+9.6 percent)
- The worst performer was Ethanol (-16.1 percent), followed by Natural gas (-10.6 percent.
In 2016, this pack was the best performer with 38.5 percent average gains. But in 2017 pack has not done well. However, it has recovered from the earlier loss and was up 4.94 percent.
2018 performance:
- In 2018, Natural gas was the best performer with a 0.4 percent loss, and the rest of the pack has done far worse.
- The worst performer has been Gasoline, which was down 30.7 percent, followed by WTI crude (-28.6 percent), Brent (-21.7 percent), Heating oil (-21.1 percent), and Ethanol (-4.3 percent).
As a whole, the energy pack was down 17.8 percent in 2018.
2019 performance:
- In 2019, Gasoline is the best performer with 42.5 percent gain, followed by, WTI crude (+33.8 percent), Brent crude (+29.7 percent), Heating oil (+21.3 percent), and Ethanol, which is up +8.9 percent.
- The worst performer has been Natural gas (-10.5 percent).
As a whole, the energy pack is up 20.9 percent in 2019. The pack is up 0.4 percent since our last review, a month ago.


