


 FxWirePro- Major Crypto levels and bias summary
  FxWirePro: EUR/AUD slips after surprise U.S. employment data
  AUDJPY Bears Poised: Sell Rallies at 111.55 for 108 Target with 112.20 Stop
  FxWirePro: AUD/USD eases as investors await U.S. employment figures
  FxWirePro: USD/ZAR gains some ground, but downtrend remains
  FxWirePro- Major Pair levels and bias summary
  FxWirePro: GBP/USD rises as weak U.S. jobs data pressures dollar
  FxWirePro- Major Crypto levels and bias summary
  FxWirePro: NZD/USD retreats as Middle East instability weighs
  FxWirePro- Major Pair levels and bias summary
  Bitcoin Reclaims $65,000 as Easing Geopolitical Tensions Fuel Risk-On Rally
  Major Pair Currency Score: NZD/USD and AUD/USD Lead Forex Rally with Perfect 100 Scores
  FxWirePro: USD/CNY slips as strong China exports data Lift yuan
  EUR/USD Rockets Past 1.1560 as Soft U.S. Jobs Data Fuel Fed Rate-Cut Surge


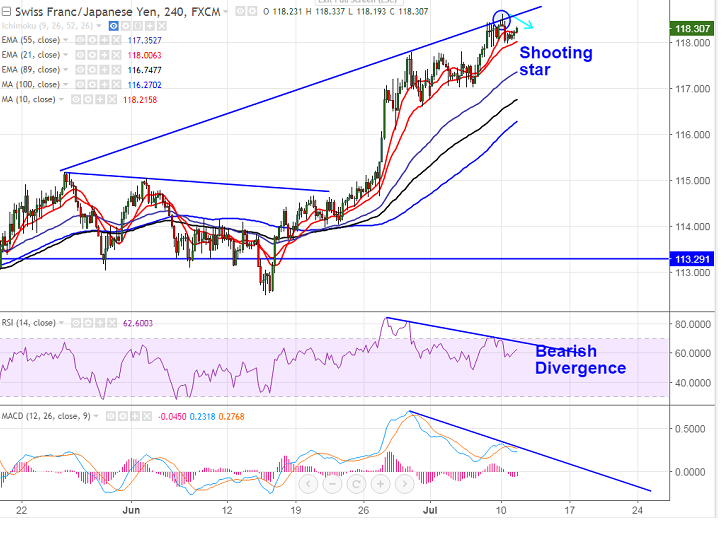
- Candlestick pattern formed – Shooting star (4 hour chart).
- The pair has shown a trend of bullishness for the past one month from the low of 112.58 made on Jun 14th 2017. It hits high of 118.60 yesterday and is currently trading around 118.30.
- Technically the pair is facing major support around 117.80 (4H Kijun-Sen) and any break below confirms minor weakness. Any break below will drag the pair down till 117.30/116.22 (100- 4H MA).
- In the 4H chart, the pair has formed bearish divergence in RSI and MACD. So a minor dip till 117.30 is possible.
- On the higher side, 118.60 will be acting as major resistance and any break above will take the pair till 119.25/120 in the short term.
It is good to sell on rallies around 118.55-118.60 with SL around 119.25 for the TP of 117.80/117.30.
Resistance
R1-118.60
R2 -119.25
R3- 120
Support
S1-117.80
S2-117.30
S3-116.22







