


 Goldman Sachs Raises USD/JPY Forecast, Sees Yen Weakness Persist Through 2027
  Smartphones are helping filmmakers tell the stories the movie industry overlooks
  In a rebuke to Trump, the Supreme Court rules that birthright citizenship is the law of the land
  USA at 250: the Black American struggle for life, liberty and the pursuit of happiness
  Citi Raises TSMC Price Target as AI Chip Demand Strengthens Growth Outlook
  Goldman Sachs Flags 3 Key Risks Ahead of Europe’s Earnings Season
  Bank of America Upgrades T-Mobile to Buy, Says LEO Satellite Fears Are Overdone
  Buy the Dip: Gold Holds Strong at $3980, Targets $4150
  Morgan Stanley Names BAE Systems Top European Defence Stock Despite Lower Price Target
  Vietnam’s population hit the 100 million milestone. Where’s it headed?


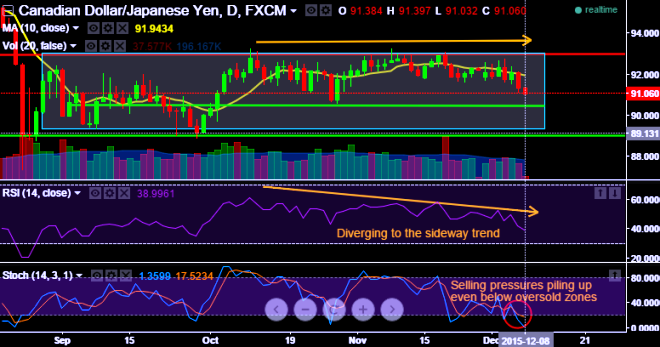
Lot of mystifying has been happening in CADJPY when we consider the intermediate trend of this pair, it is struggling since 21st August to clear and sustain crucial resistance at 92.90 levels, since then we've been noticing the narrow range trend as you can observe the grey shaded rectangular area.
On the contrary leading indicators on the daily charts have started diverging the current sideway trend that would suggest the short term downtrend trend to begin.
Weekly RSI has started diverging with price spikes near 45 level (Currently, RSI at 40.7121), while slow stochastic is also stating indecisiveness and we observe %D line crossover above 80 levels on daily terms that generates selling pressure at this point of time.
Volumes are in conformity to the price slumps.
As a result, prevailing prices are slipping below 10DMA that signifies the current price drops would drag further to find strong support zone at around 90.50 levels to bounce back again.
Trade recommendations: As the pair is likely to hit levels around 90.50, it is advisable to buy binary delta puts with strict risk appetite upto 91.50.

- News

- Economy

- Central Banks
- Investing
- Research
- Roundups
- Digital Currency
- Insights
- Technical Analysis
- Technology
- Business
- Law
- Health
- Nature
- Fintech
- Science
- Topic
- Opinions
- ©Econometrics LLC . All Rights Reserved.
FxWirePro: CAD/JPY to slip further around 90.50 upon multiple confirmation
Tuesday, December 8, 2015 6:10 AM UTC
Editor's Picks


- Market Data
Most Popular


