


 Bitcoin Tumbles Below $60,000 Amidst Persistent ETF Outflows
  FxWirePro: NZD/USD recovers slightly but bearish outlook persist
  FxWirePro : AUD/USD drifts lower, could be on verge of bigger drop
  FxWirePro: GBP/AUD gaining momentum for a move towards 1.9350 level
  ETHUSD Forms Double Bottom at $1500, Signaling Potential Bullish Reversal
  FxWirePro: EUR/USD slips lower on cooler than expected Euro Zone inflation data
  GBPJPY Surges on Yen Weakness; Bullish Trend Favors Dip Buying
  AUDJPY Faces Headwinds: Selling on Rallies Advised as Bearish Trend Emerges
  FxWirePro: USD/CAD steadies around 1.4220 ,retains bid one
  FxWirePro: GBP/AUD uptrend loses steam, remains on bullish path
  BTCUSD Recovers Amid Easing Tensions, But Resistance Looms
  FxWirePro: USD/JPY consolidates gains, 163 eyed
  FxWirePro: GBP/USD gains some ground but outlook still bearish
  Gold Surges Above $4100 on Weak US Jobs Data; Bullish Momentum Builds
  FxWirePro: EUR/AUD bull’s hold the higher ground, remains on bullish path
  GBPJPY Weakens Amid Yen Strength: Sell on Rallies Recommended


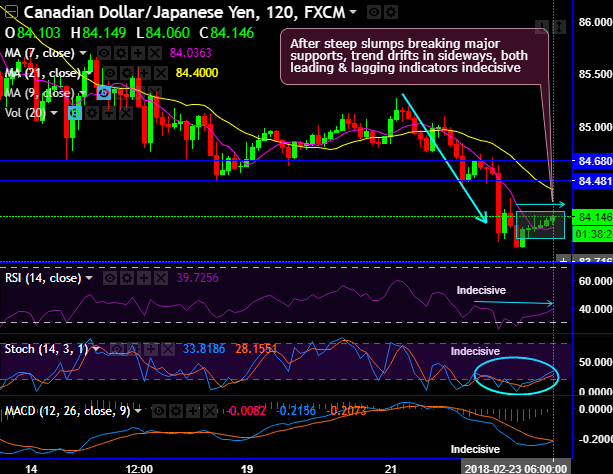
Chart and candlestick pattern formed- Shooting stars consecutively at 88.129 and 88.629 levels respectively. Rising wedge pattern had occurred earlier in intermediate trend and these bearish pattern candlesticks have managed to breach below wedge baseline which acted as the strong support (on weekly plotting).
On the other hand, after steep slumps that have broken strong supports at 84.680 and 84.481 levels in the recent past, the minor trend drifts in sideways for the day (refer range bounded pattern in the rectangular shaped area on 2H plotting).
On this time frame, both leading & lagging indicators (RSI and stochastic curves) have been indecisive to signal either steep slumps or sharp rallies.
The minor trend is stuck in a range on 2H chart, the swings drift non-directional on this timeframe, more rallies seem to be on cards as the current prices spike above 7SMAs, but within 21SMA as both leading & lagging oscillators are yet to and unlikely to substantiate this bullish stance by converging upwards.
On the broader perspective, please observe the troughs and tides within the channel that form the rising wedge pattern (which has bullish in nature so far), but shooting star pattern candles have managed to break-out below wedge support, as a result, CADJPY intermediate bears resume and evidences steep slumps below EMAs (refer weekly plotting).
For now, we could foresee more price dips upto next strong supports at 83.00 levels, the break out of these levels would even drag upto 80.703 levels as you could easily spot on bearish EMA crossover. While both leading oscillators (RSI & stochastic curves) indicate mounting bearish momentum as these indicators converge downwards to the price dips constantly.
To substantiate this bearish stance, another trend indicator (MACD) has also been indicating bearish crossover that signal downtrend to prolong further.
Trade tips:
Contemplating both intraday and intermediate trend observations, it is wise to buy boundary binary options strategy on trading grounds. Use upper strikes at 84.4029 and 83.925, with this leveraged product one can add magnified impact on the trade yields.
The trading between these strikes likely to derive certain yields in this perplexed trend in the short term and the major trend, more importantly, these yields are exponential from spot movements.
For cash or nothing, these options would be exercised if the forward prices to remain between both strikes (i.e. 84.4029 > Fwd price > 83.925).
Currency Strength Index: FxWirePro's hourly CAD spot index is displaying shy above -8 levels (neutral), while hourly JPY spot index was at 96 (bullish) while articulating (at 06:41 GMT). For more details on the index, please refer below weblink:
http://www.fxwirepro.com/currencyindex
FxWirePro launches Absolute Return Managed Program. For more details, visit:


