


 Buy the Dip: Gold Holds Strong at $3980, Targets $4150
  Citi Raises TSMC Price Target as AI Chip Demand Strengthens Growth Outlook
  State of emergency in Crimea as Ukraine focuses pressure on ‘jewel in Putin’s crown’
  Gold Surges Past $4150 on Dovish Fed Signals and Weak Jobs Data; Bullish Outlook Prevails
  Smartphones are helping filmmakers tell the stories the movie industry overlooks
  In a rebuke to Trump, the Supreme Court rules that birthright citizenship is the law of the land
  Gold Pulls Back After Hitting $4,180 as Geopolitical Risk Sends Crude Higher
  USA at 250: the Black American struggle for life, liberty and the pursuit of happiness
  AI can be a personal trainer in your pocket – but is it safe?
  Trump has made more than $1 billion from crypto in a year. How?


On intraday charts, hammer pattern candlestick formed at 91.47 levels on declines. A hammer appears on a downtrend at or near the bottom which suggests that the market is hammering out a base.
Slow stochastic suggest oversold pressure as %D line crossover formed below 20 level. (%D line at 9.2076 & %K line at 8.6436).
As the pair is trading near lower Bollinger band at 91.3413 levels and prices are considered to be oversold if they touch the lower band, Rising prices are confirmed with the substantial volumes but not on falling side.
So please be advised that on speculation basis for an intraday trading perspective we recommend buying binary call options for targets at 91.55 and even at 91.60 levels.
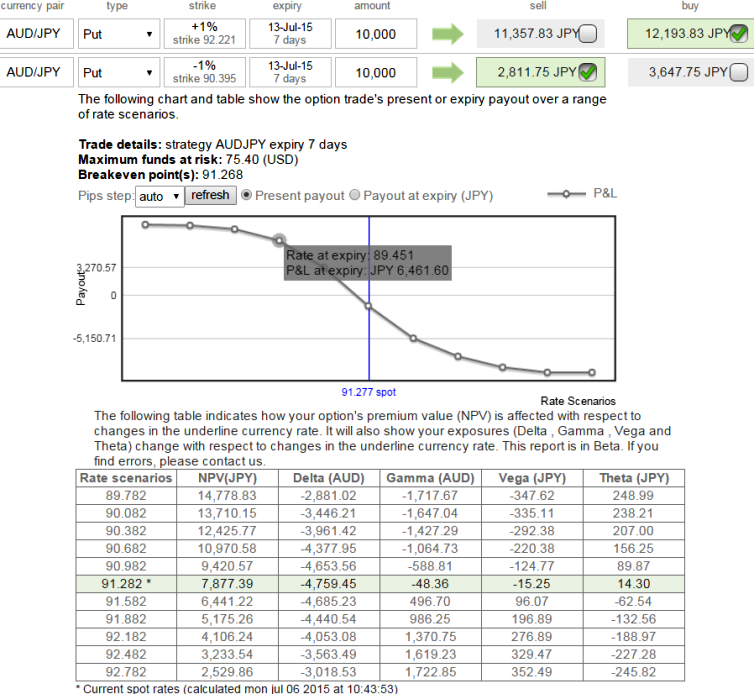
On hedging grounds, we are advocating bear put spreads to arrest downside risks as the major trend seems to be downtrend.
On weekly chart oscillators suggest downward convergence with the falling prices. RSI (14) converges price slumps at 48.4391. While stochastic shows %D line crossover but not significant though yet above 20 levels.
With a view being bearish bias we recommend buying 7D (1%) In-The-Money 0.74 delta put option while sell 7D (-1%) Out-Of-The-Money put options for a net debit (something like USD 9391.83 as shown in the diagram).

- News

- Economy

- Central Banks
- Investing
- Research
- Roundups
- Digital Currency
- Insights
- Technical Analysis
- Technology
- Business
- Law
- Health
- Nature
- Fintech
- Science
- Topic
- Opinions
- ©Econometrics LLC . All Rights Reserved.
FxWirePro: Buy AUD/JPY binary calls for speculating; put spreads for hedging
Monday, July 6, 2015 5:56 AM UTC
Editor's Picks



- Market Data
Most Popular




