


 Major JPY Action Bias — Extremely Bullish Setups in NZD/JPY, AUD/JPY and CAD/JPY
  FxWirePro- Major Crypto levels and bias summary
  FxWirePro: EUR/AUD outlook weaker on renewed downside pressure
  FxWirePro- Woodies pivot (Major)
  Jamie Dimon Warns Anthropic's Mythos AI Poses National Security Risks
  FxWirePro- Major Crypto levels and bias summary
  US Inflation Expected to Ease in June, but Fed Rate Hike Risks Persist Amid Middle East Tensions
  FxWirePro: USD/CAD falls after BoC rate hold and weak U.S. producer inflation
  ETHUSD Bullish Momentum: Follows BTC Above All EMAs, Buy Dips Near $1750 Targeting $2300
  FxWirePro: EUR/AUD bears maintain upper hand
  FxWirePro :USD/JPY bulls loosen their grip a bit, dips to be bought


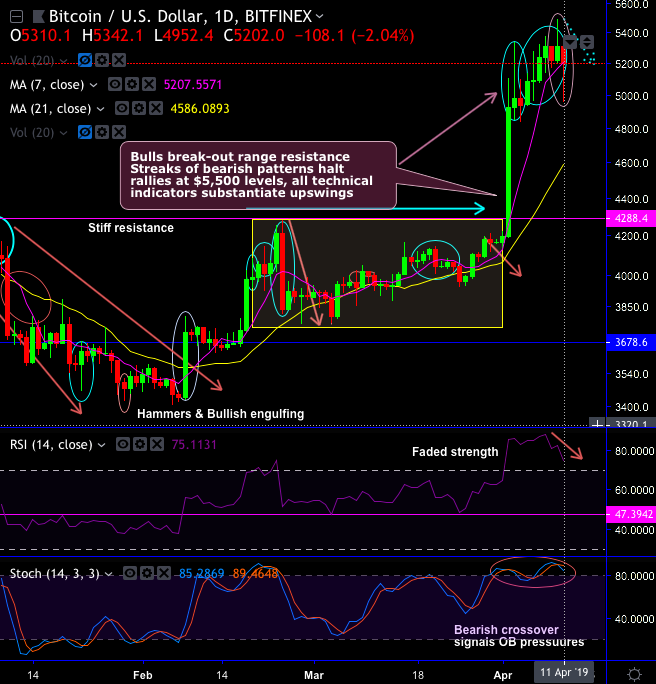
Bitcoin has been spiking higher from the last couple of weeks, rose from the lows of $3,405.30 levels to the current $5,298.60 levels which is almost more than 37% so far (i.e. 10% in March month and 27% in April month series).
But for now, the rallies are halted upon below-mentioned candlesticks.
Technically, BTCUSD price chart has shown bearish sentiments for the day upon the occurrences of shooting stars, long-legged doji, and hanging man pattern candlesticks (refer daily chart).
Shooting stars at $4,978.00 and $5,310.10 levels, long-legged doji at $5,091.10 and hanging man at $5,312.40 levels. Consequently, the price slides below 7DMAs.
To substantiate this current selling sentiment, all momentum indicators are in line with the price dips. Both RSI and Stochastic curves signal the overbought pressures.
On the contrary, the bullish engulfing pattern has occurred at $4,071.70 levels on the weekly terms. Ever since then the pair kept spiking higher constantly, it has now gone above 21-EMAs and DMAs Thereby, the pair hits the psychological price levels of the $5.25k mark. Followed by, the majority of the crypto fraternity experienced middling performance with a few select altcoin markets surging strongly.
While lagging indicators (MACD on this timeframe) show bullish crossovers, that signal uptrend to prolong further in the weeks to come.
On the back of these bullish price sentiments, the pioneer cryptocurrency (Bitcoin) and its counterparts sensed eye-catchy market-capitalization growth in the recent past.
As the Bitcoin price is now subjected to some uncertain momentum on either side, the price prediction on an intermediate-term appears to be more essential for now. The above analytical effort seems to be edgy in the minor trend and buying opportunities can get pretty interesting for the medium-long terms, although quite a few dubious eyes may not agree with these outlooks.
Currency Strength Index: FxWirePro's hourly BTC spot index is inching towards -126 levels (which is highly bearish), USD is at 11 (mildly bullish), while articulating (at 12:47 GMT).
For more details on the index, please refer below weblink: http://www.fxwirepro.com/currencyindex


