


 FxWirePro: NZD/USD gains on GDP beat,but downside trend holds
  FxWirePro: USD/CAD extends gains ahead of Fed rate decision
  FxWirePro: GBP/AUD edges lower after Fed 25Bp hike, focus shifts to Thursday BoE
  FxWirePro: USD/JPY dips as yen firms ahead of expected BoJ rate hike
  FxWirePro: AUD/USD gains some ground but outlook is bearish
  FxWirePro- Major Crypto levels and bias summary
  Major Pair Currency Score: EURUSD and GBPUSD Extremely Bearish, USDCAD and USDCHF Extremely Bullish
  Bitcoin Dips Below $76,000 Amidst ETF Outflows and Technical Signals


 Add as a preferred source on Google
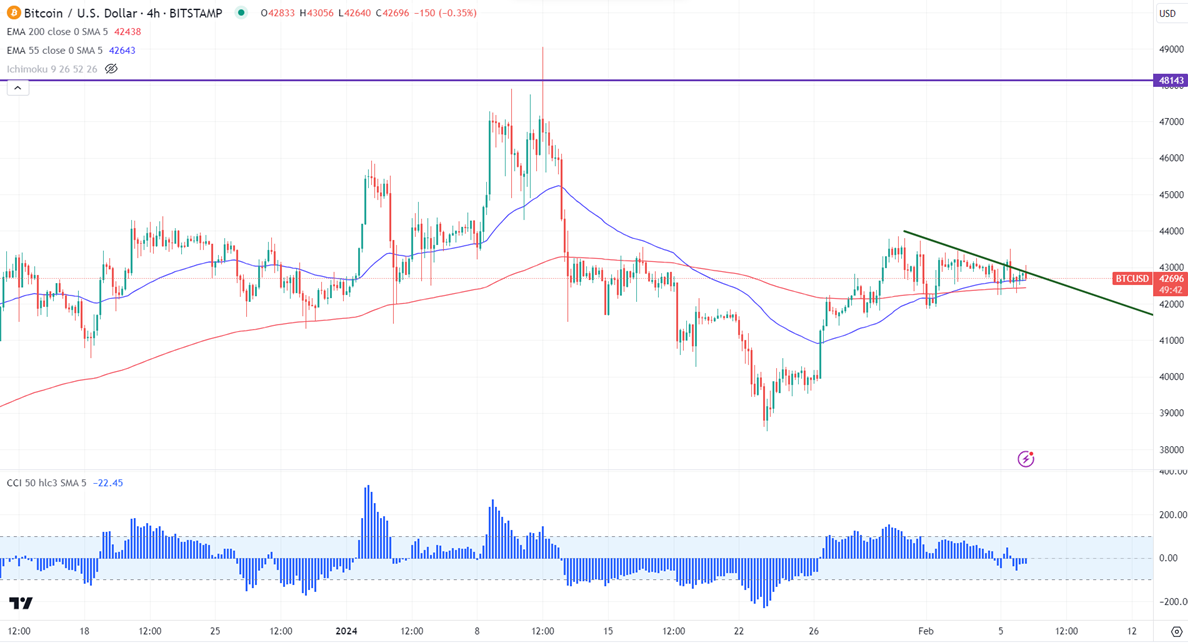
BTCUSD's price has traded in a narrow range between $43799 and $41759 for the past week. It has pared some of its gains after hawkish comments from Fed Chairman Powell. It hit a low of $4228 yesterday and is currently trading around $ 43158.
The Bitcoin market value to realized value (MVRV) ratio falls below its 90-day average over the past 12 months.
Factors to watch for Bitcoin price action-
US markets -
NASDAQ (negative correlation with BTC) - Bullish (neutral for BTC). The NASDAQ recovered sharply after Goldman Sachs upgraded the target of NVIDIA to $800 from $625. Any break above 17800 will take the index to 18000/18200.
According to the CME Fed watch tool, the probability of a no-rate cut in Mar increased to 83.5% from 52.9% a week ago.
Technicals-
BTCUSD trades above the short-term moving average (21 and 55 EMA) and above the long-term moving average (200 EMA) in the daily chart.
Minor support- $41700. Any break below will take it to the next level at $41400/$40700/$38500.
Bull case-
Primary supply zone -$44000. Any surge past this level confirms an intraday bullishness. A jump to $45000/$46180/$49050 is possible.
Secondary barrier- $50000. A close above that barrier targets $52500/$60000.
It is good to buy on dips around $42000 with SL around $40700 for TP of $50000.







