


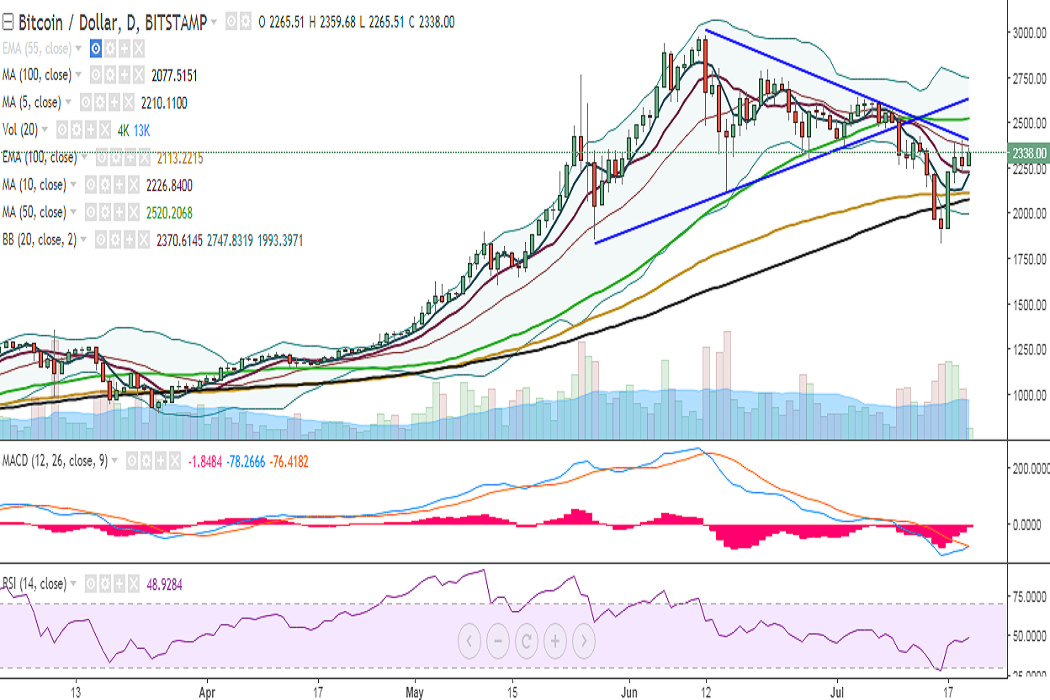
BTC/USD failed to hold above 2400 levels on Wednesday and closed at 2265 levels. It is currently trading at 2316 levels at the time of writing (Bitstamp).
Ichimoku analysis of daily chart:
Tenkan Sen: 2127.58
Kijun Sen: 2234.73
On the upside, immediate resistance is seen at 2369 (20-DMA) and a break above would target 2390 (trend line joining 2980 and 2639)/2466 (78.6% retracement of 2369.47 and 1830). Further strength would see it testing 2520 (50-DMA)/2549 (Cloud top)/2617 (trend line joining 1850 and 2120).
On the reverse side, support is seen at 2254 (4h 20-SMA) and any violation would see it testing 2224 (10-DMA)/2176 (2h 50-SMA). Further weakness would drag it to 2112 (100-EMA)/2077 (100-DMA)/1992 (Lower Bollinger).
Momentum studies: On the daily chart, RSI is at 48, MACD appears to be on the verge of a bullish crossover, and stochs are biased higher. A consistent break above the trend line resistance coupled with RSI moving above 50 would see further bullishness in the pair.
Recommendation: Good to go long on break above 2390. SL: 2216. TP: 2520/2617.
FxWirePro launches Absolute Return Managed Program. For more details, visit http://www.fxwirepro.com/invest

- News

- Economy

- Central Banks
- Investing
- Research
- Roundups
- Digital Currency
- Insights
- Technical Analysis
- Technology
- Business
- Law
- Health
- Nature
- Fintech
- Science
- Topic
- Opinions
- ©Econometrics LLC . All Rights Reserved.
FxWirePro: BTC/USD upside capped by trend line resistance, good to go long on break above
Thursday, July 20, 2017 10:15 AM UTC
Editor's Picks


- Market Data
Most Popular


