


 FxWirePro- Major Crypto levels and bias summary
  BTCUSD Bullish Breakout: Clears 800-EMA After Consolidation, Buy Dips Toward $74,900
  FxWirePro: GBP/USD advance after softer US inflation dims Fed rate hike bets
  FxWirePro:EUR/NZD extends fall, key support lies ahead
  FxWirePro: GBP/NZD downtrend slows, but bearish sentiment remains
  FxWirePro- Major Crypto levels and bias summary
  Crypto Major Pair Action Bias: ETHUSD Bullish as BTCUSD, SOLUSD & XRPUSD Stay Neutral
  FxWirePro :USD/JPY bulls loosen their grip a bit, dips to be bought
  FxWirePro: EUR/AUD bears maintain upper hand
  FxWirePro- Major Pair levels and bias summary
  FxWirePro- Woodies pivot (Major)


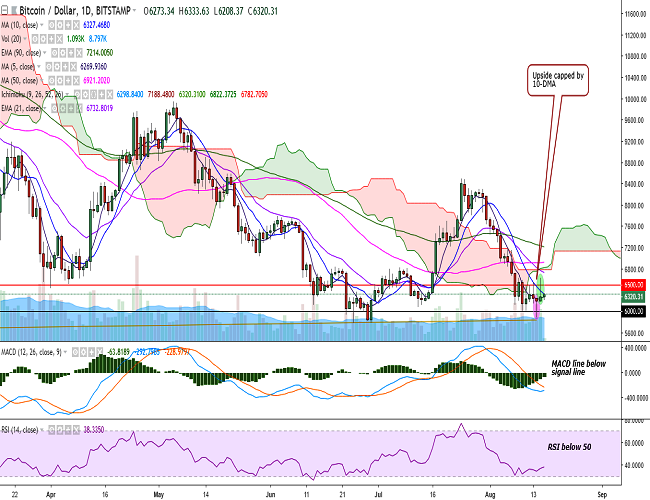
(Refer BTC/USD chart on Trading View)
BTC/USD surged to 6628 levels on Wednesday but failed to close above 10-DMA and closed at 6272 levels, forming an inverted hammer pattern.
The pair is currently trading around 6300 levels at the time of writing (Bitstamp).
On the upside, a consistent break above 6325 (10-DMA) would see it testing 6497 (23.6% retracement of 8496.96 and 5880)/6556 (3h 100-SMA). Further strength would target 6657 (4h 90-EMA)/6782 (cloud bottom).
On the downside, support is seen at 6248 (1h 50-SMA) and a break below would drag it to would 6120 (June 13 low)/6000. Further weakness would test 5880 (August 14 low)/5780 (June 24 low).
On the daily chart, the formation of hammer pattern followed by an inverted hammer suggests current market indecisiveness. The pair is trading in a close range today with its upside capped by 10-DMA.
Watch out for a close above 10-DMA for minor upside in the pair.

- News

- Economy

- Central Banks
- Investing
- Research
- Roundups
- Digital Currency
- Insights
- Technical Analysis
- Technology
- Business
- Law
- Health
- Nature
- Fintech
- Science
- Topic
- Opinions
- ©Econometrics LLC . All Rights Reserved.
FxWirePro: BTC/USD upside capped by 10-DMA, close above to see minor upside
Thursday, August 16, 2018 7:15 AM UTC
Editor's Picks


- Market Data
Most Popular


