


 BTC’s Bear Bounce: Sell the Rally Near $66K as Bears Target $59K–$52K Breakdown
  FxWirePro- Major Crypto levels and bias summary


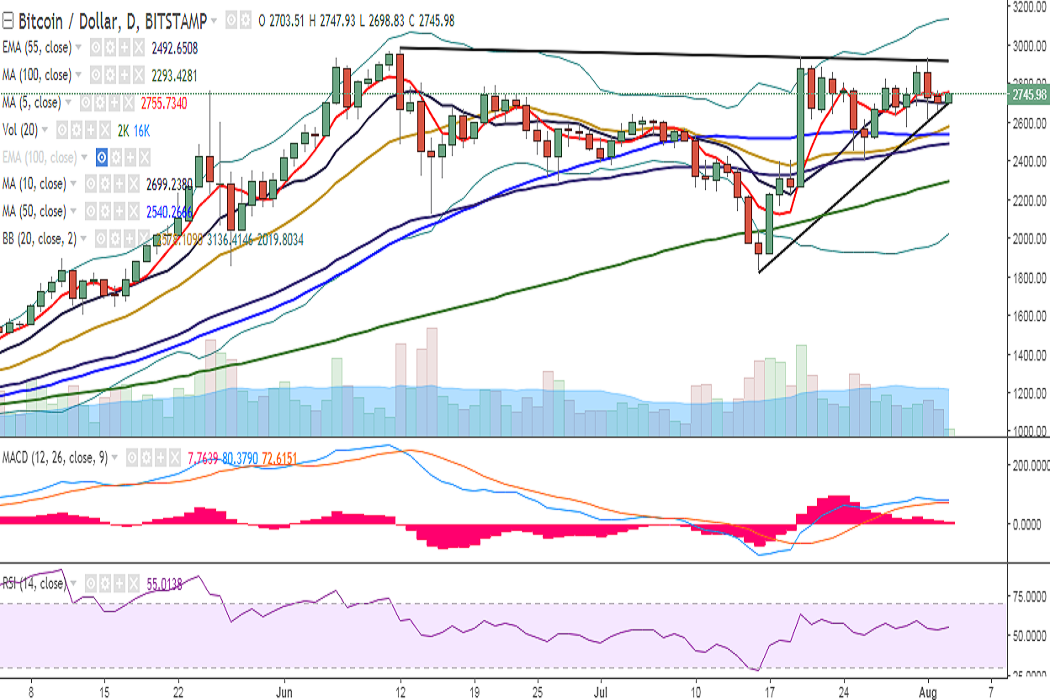
BTC/USD is trading in an extremely narrow range on Thursday between 5- and 10-DMA. It is currently trading at 2746 levels at the time of writing (Bitstamp).
Ichimoku analysis of daily chart:
Tenkan Sen: 2664.58
Kijun Sen: 2384
On the upside, immediate resistance is seen at 2753 (5-DMA) and a break above would see the pair testing 2825 (28 July high)/2849 (4h upper bollinger)/2922 (trend line joining 2980 and 2938). Further uptrend would target 2980 (June 12 high)/3091 (113% retracement of 2980 and 2120).
On the reverse side, a close below 2724 (trend line joining 1830 and 2622) would drag it to 2676 (23.6% retracement of 1830 and 2938)/ 2615 (August 01 low)/2540 (50-DMA). Further weakness would target 2492 (55-EMA)/ 2400 (July 26 low).
Momentum studies: On the daily chart, stochs are biased lower, RSI is holding above 50, and MACD is closing in on the signal line. Bias appears slightly bullish on the hourly charts. Back to back doji formations on the weekly charts suggest market indecisiveness. Traders are preferred to wait for a confirmed signal on the daily chart.
Recommendation: Wait for a clear directional bias.
FxWirePro launches Absolute Return Managed Program. For more details, visit http://www.fxwirepro.com/invest

- News

- Economy

- Central Banks
- Investing
- Research
- Roundups
- Digital Currency
- Insights
- Technical Analysis
- Technology
- Business
- Law
- Health
- Nature
- Fintech
- Science
- Topic
- Opinions
- ©Econometrics LLC . All Rights Reserved.
FxWirePro: BTC/USD trades in tight range, bias neutral
Thursday, August 3, 2017 10:02 AM UTC
Editor's Picks


- Market Data
Most Popular


