


 FxWirePro- Major Crypto levels and bias summary
  FxWirePro- Major Crypto levels and bias summary
  BTC’s Bear Bounce: Sell the Rally Near $66K as Bears Target $59K–$52K Breakdown


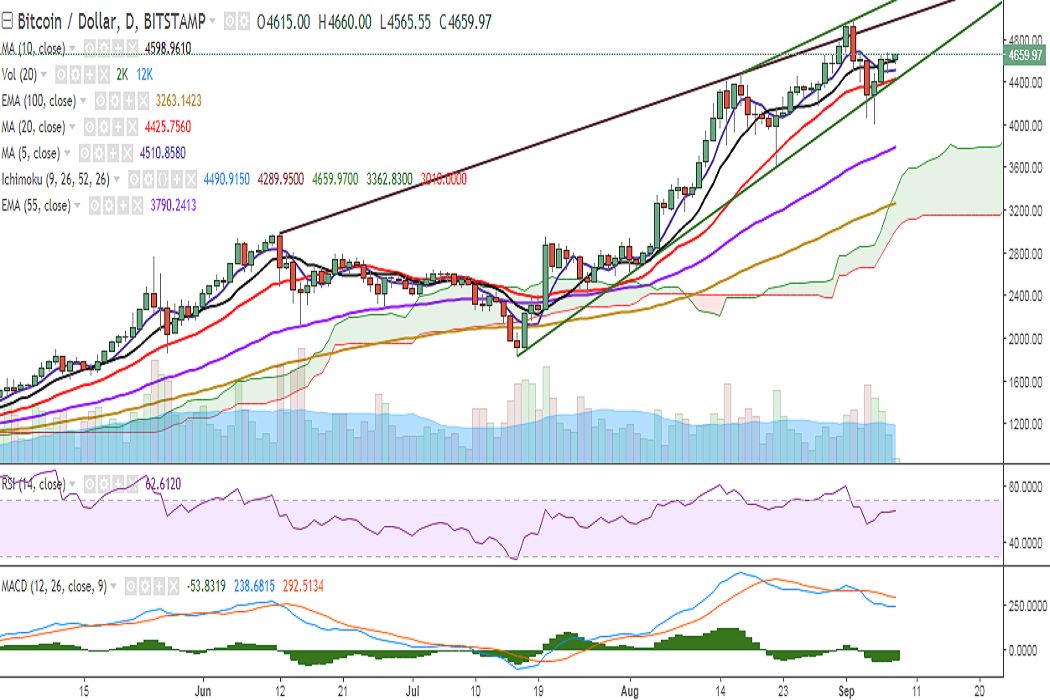
BTC/USD is trading in a narrow range after it hit 4674 levels on Thursday. It is currently trading at 4659 levels at the time of writing (Bitstamp).
Ichimoku analysis of daily chart:
Tenkan Sen: 4490.91
Kijun Sen: 4289.95
On the upside, resistance is likely to be found at 4700 levels and a break above would see it testing 4770 (78.6% retracement of 4979.90 and 4001.93)/ 4824 (113% extension of 1830 and 4480). Further strength would see the pair testing 4900/4979 (September 02 high)/5045/5138.
On the downside, support is seen at 4597 (10-DMA) and any violation would drag it to 4508 (5-DMA)/4425 (convergence of 20-DMA and trend line joining 1830 and 3600). Further weakness would drag it to 4371(23.6% retracement of 2400 and 4979.90)/4289 (50% retracement of 3600 and 4979.90)/ 4145 (4h 200-SMA).
On the daily chart, RSI and stochs are biased higher while MACD line is below the signal line. The doji formation on September 7 suggests market indecisiveness, however, the pair closed above 10-DMA.
Bias appears slightly bullish on the 4-hour chart.
Recommendation: Wait for clear directional bias.
FxWirePro launches Absolute Return Managed Program. For more details, visit http://www.fxwirepro.com/invest

- News

- Economy

- Central Banks
- Investing
- Research
- Roundups
- Digital Currency
- Insights
- Technical Analysis
- Technology
- Business
- Law
- Health
- Nature
- Fintech
- Science
- Topic
- Opinions
- ©Econometrics LLC . All Rights Reserved.
FxWirePro: BTC/USD trades in a narrow range, bias neutral
Friday, September 8, 2017 9:36 AM UTC
Editor's Picks


- Market Data
Most Popular


3


