


 FxWirePro- Major Crypto levels and bias summary
  Ethereum Cracks Under $1,700: Sell the Rally Near $1,750 as Bears Eye $1,380–$1,200
  BTC’s Bear Bounce: Sell the Rally Near $66K as Bears Target $59K–$52K Breakdown


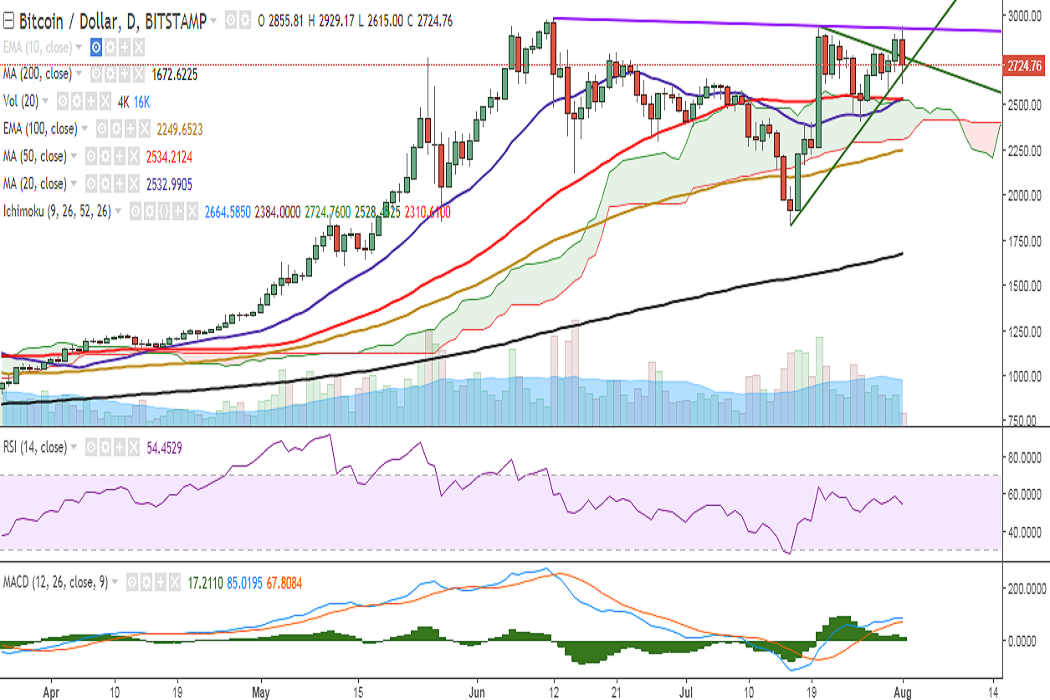
BTC/USD broke above the trend line joining 2938 and 2825 and hit 2929 levels earlier in the day. However, the pair failed to sustain its upward momentum and is currently trading in the red at 2727 levels at the time of writing (Bitstamp).
Ichimoku analysis of daily chart:
Tenkan Sen: 2664.58
Kijun Sen: 2384
On the upside, a close above 2768 (trend line joining 2938 and 2825) would see the pair testing 2825 (28 July high)/ 2924 (trend line joining 2980 and 2938). Further uptrend would target 2980 (June 12 high)/3091 (113% retracement of 2980 and 2120).
On the reverse side, the pair is trading just above 2675 (trend line joining 1830 and 2569) and a decisive break below would drag it to 2569 (July 30 low)/2533 (50-DMA). Further weakness would target 2474 (55-EMA)/ 2400 (July 26 low)/2310 (Cloud bottom).
Momentum studies: On the daily chart, RSI is at 54, and MACD line is above signal line with fading upward momentum. Overall bias appears neutral.
Some scope for further downside could be seen in the hourly charts.
On the weekly chart, back to back doji formations suggest weakness in trend. However, stochs and RSI are biased higher.
Recommendation: Wait for a clear directional bias.
FxWirePro launches Absolute Return Managed Program. For more details, visit http://www.fxwirepro.com/invest

- News

- Economy

- Central Banks
- Investing
- Research
- Roundups
- Digital Currency
- Insights
- Technical Analysis
- Technology
- Business
- Law
- Health
- Nature
- Fintech
- Science
- Topic
- Opinions
- ©Econometrics LLC . All Rights Reserved.
FxWirePro: BTC/USD rejected at trend line resistance, bias neutral
Tuesday, August 1, 2017 10:17 AM UTC
Editor's Picks


- Market Data
Most Popular


