


 FxWirePro- Major Crypto levels and bias summary
  FxWirePro- Major Crypto levels and bias summary
  BTC’s Bear Bounce: Sell the Rally Near $66K as Bears Target $59K–$52K Breakdown
  FxWirePro- Major Crypto levels and bias summary


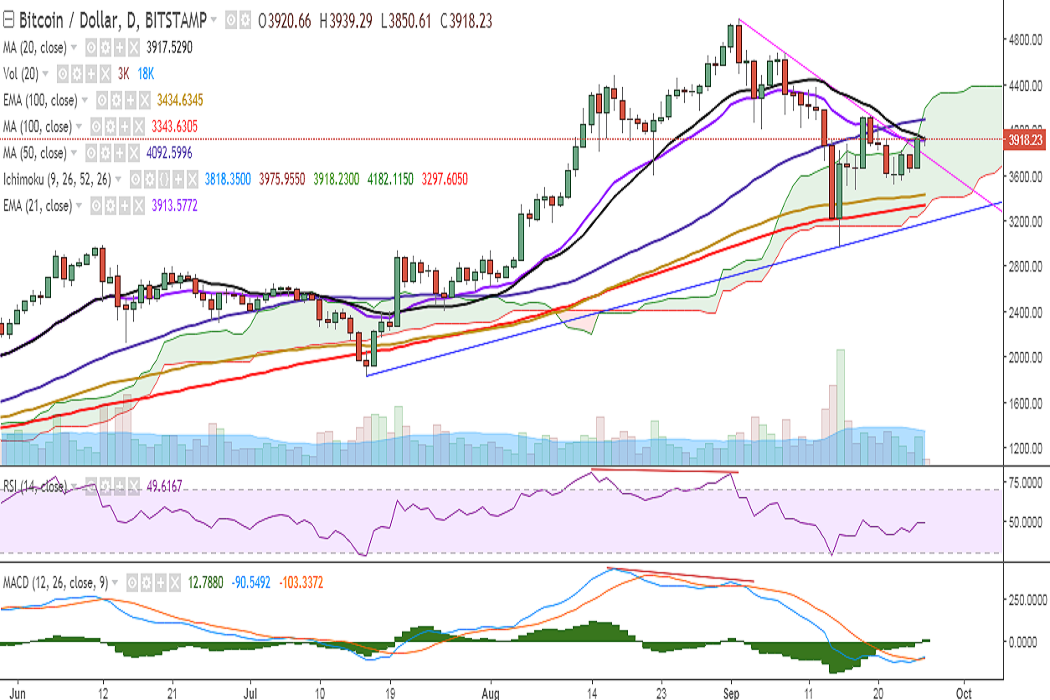
BTC/USD is hovering around 20-DMA as it broke above trend line joining 4979.90 and 4679.97. It is trading at 3900 levels at the time of writing (Bitstamp).
Ichimoku analysis of daily chart:
Tenkan Sen: 3818.35
Kijun Sen: 3975.95
On the upside, a consistent break above 3917 (20-DMA) would see the pair testing 3975 (50% retracement of 4979.90 and 2972.01)/4092 (50-DMA). Further strength would target 4122 (September 18 high)/ 4182 (Cloud top)/ 4212 (61.8% retracement of 4979.90 and 2972.01)/ 4300/4480 (August 17 high).
On the flipside, support is seen at 3844 (2h 200-SMA) and any violation would drag it to 3776 (38.2% retracement of 1830 and 4979.90)/3734 (2h 50-SMA). Further weakness would see it testing 3600 (August 22 low)/3547 (4h cloud bottom)/3500/3434 (100-EMA).
Momentum studies: On the daily chart, RSI is holding at 49, stochs are biased higher, and MACD appears to be on the verge of a bullish crossover.
On the 4-hour chart, the pair is consolidating its break above the Ichimoku Cloud. Both RSI and MACD are biased higher.
However, on the weekly chart, RSI is strong at 65, while stochs are biased lower.
Watch out for a decisive break above 20-DMA for scope for further upside.
FxWirePro launches Absolute Return Managed Program. For more details, visit http://www.fxwirepro.com/invest

- News

- Economy

- Central Banks
- Investing
- Research
- Roundups
- Digital Currency
- Insights
- Technical Analysis
- Technology
- Business
- Law
- Health
- Nature
- Fintech
- Science
- Topic
- Opinions
- ©Econometrics LLC . All Rights Reserved.
FxWirePro: BTC/USD hovers around 20-DMA, break above to see further bullishness
Tuesday, September 26, 2017 9:00 AM UTC
Editor's Picks


- Market Data
Most Popular


3


