


 FxWirePro- Major Crypto levels and bias summary
  BTC’s Bear Bounce: Sell the Rally Near $66K as Bears Target $59K–$52K Breakdown


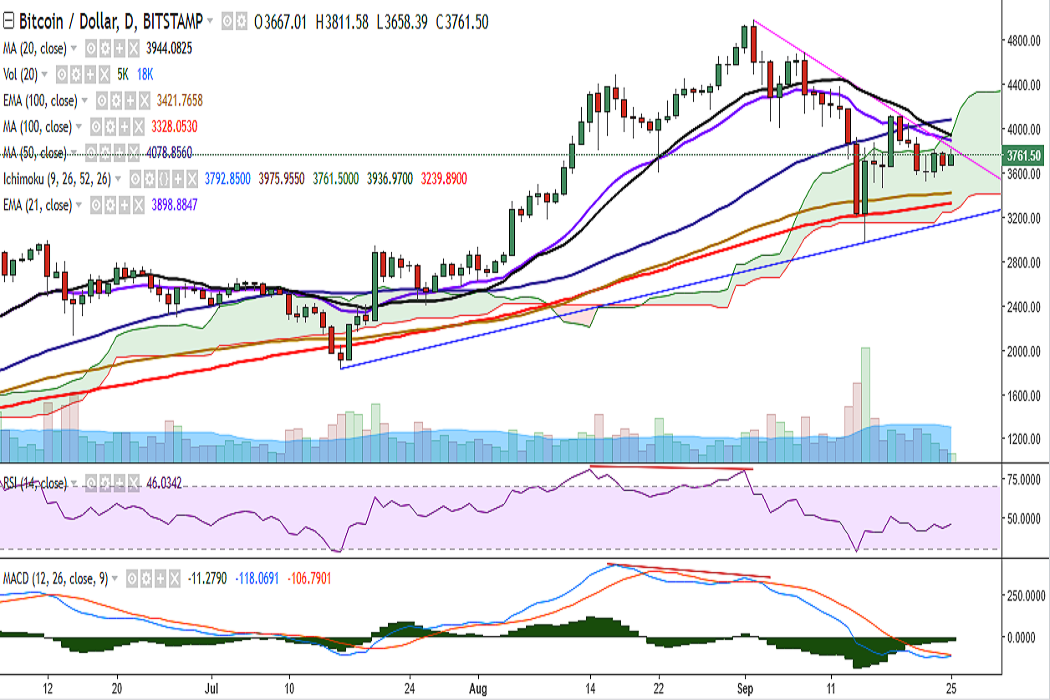
BTC/USD is consolidating inside Ichimoku Cloud on Monday as it faces strong trend line resistance at 3827 levels. It is currently trading at 3756 levels at the time of writing (Bitstamp).
Ichimoku analysis of daily chart:
Tenkan Sen: 3792.85
Kijun Sen: 3975.95
On the upside, resistance is seen at 3827 (trend line joining 4979.90 and 4679.97) and a break above would see it testing 3868 (4h 100-SMA)/3944 (20-DMA). Further strength would see it testing 4000/4078 (50-DMA)/4161 (4h 200-SMA).
On the flipside, support is seen at 3700 (2h 50-SMA) and any violation would drag the pair to 3668 (4h cloud bottom)/3600 (August 22 low). Further weakness would drag it to 3514 (September 22 low)/3421 (100-EMA)/3328 (100-DMA)/3033 (61.8% retracement of 1830 and 4979.90).
Momentum studies: On the daily chart, stochs are biased slightly higher, MACD appears on the verge of a bullish crossover on the signal line, and RSI is below 50.
Bias appears bullish on the hourly charts.
On the weekly chart, the pair is trading just shy of 10-SMA, stochs are biased lower. RSI is strong at 63.
Recommendation: Wait for clear directional bias. Watch out for a break above 3827 levels.
FxWirePro launches Absolute Return Managed Program. For more details, visit http://www.fxwirepro.com/invest

- News

- Economy

- Central Banks
- Investing
- Research
- Roundups
- Digital Currency
- Insights
- Technical Analysis
- Technology
- Business
- Law
- Health
- Nature
- Fintech
- Science
- Topic
- Opinions
- ©Econometrics LLC . All Rights Reserved.
FxWirePro: BTC/USD faces strong trend line resistance at 3827, break above targets 3944
Monday, September 25, 2017 7:39 AM UTC
Editor's Picks


- Market Data
Most Popular


3


