


 FxWirePro- Major Crypto levels and bias summary
  Bitcoin Buckles at $73,500: Middle East Tensions and Weak Institutional Demand Set Bearish EMA Stack on $70K Collision Course
  FxWirePro- Major Crypto levels and bias summary
  Bitcoin Cracks $75K as $1.3B ETF Exodus and Middle East Jitters Spook Bulls; Bears Eye $70K
  Ethereum Tumbles Below $2K: Bears Eye $1,700 as All Key EMAs Flip Red


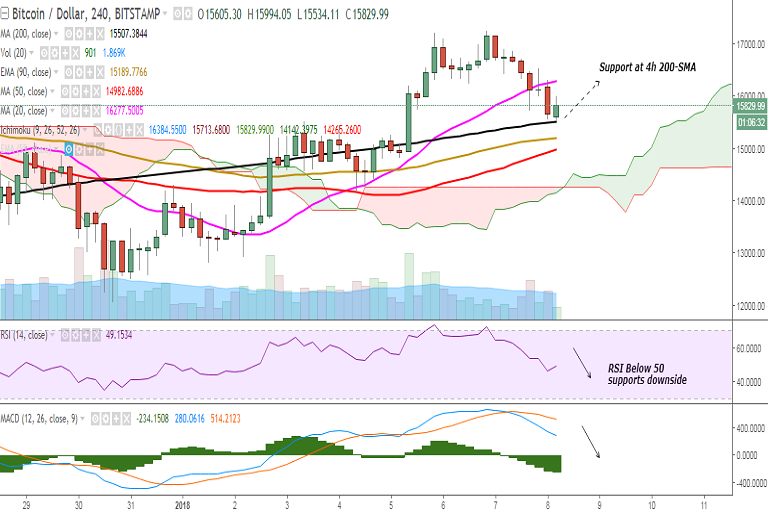
BTC/USD is trading in the red after it surged to 17234 levels on January 06. It is currently trading at 15937 levels at the time of writing (Bitstamp).
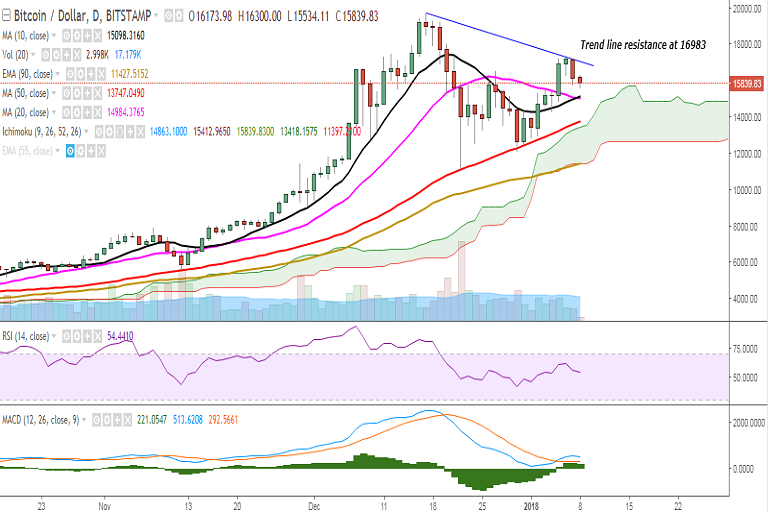
Ichimoku analysis of daily chart:
Tenkan Sen: 14863.10
Kijun Sen: 15412.96
On the topside, a consistent break above 16281 (4h 20-SMA) would see the pair testing 16460 (1h 50-SMA)/16983 (trend line joining 19666 and 17234). Further strength would target 17234 (January 06 high)/17845 (78.6% retracement of 19666 and 11159.93)/18000.
On the reverse side, a decisive break below 15726 (23.6% retracement of 2972.01 and 19666) would drag the pair to 15507 (4h 200-SMA)/15106 (10-DMA). Further weakness would see it testing 14685 (4h 100-SMA)/14275 (38.2% retracement of 5555.55 and 19666)/13748 (50-DMA).
Momentum studies: On the daily chart, RSI is at 55 but bias is lower and stochs are on the verge of a rollover from overbought levels. The pair faces strong trend line resistance at 16983 and further bullishness could be confirmed only on a break above.
On the 4h chart (see image below), the pair has found strong support near 200-SMA and a break below would see further downside.
Recommendation: Good to go short on break below 15500. SL: 16250. TP: 15100/14685
FxWirePro launches Absolute Return Managed Program. For more details, visit http://www.fxwirepro.com/invest

- News

- Economy

- Central Banks
- Investing
- Research
- Roundups
- Digital Currency
- Insights
- Technical Analysis
- Technology
- Business
- Law
- Health
- Nature
- Fintech
- Science
- Topic
- Opinions
- ©Econometrics LLC . All Rights Reserved.
FxWirePro: BTC/USD faces strong trend line resistance at 16983, good to go short on break below 4h 200-SMA
Monday, January 8, 2018 6:55 AM UTC
Editor's Picks


- Market Data
Most Popular


