


 FxWirePro- Major Crypto levels and bias summary
  FxWirePro- Major Crypto levels and bias summary
  Ethereum Cracks Under $1,700: Sell the Rally Near $1,750 as Bears Eye $1,380–$1,200


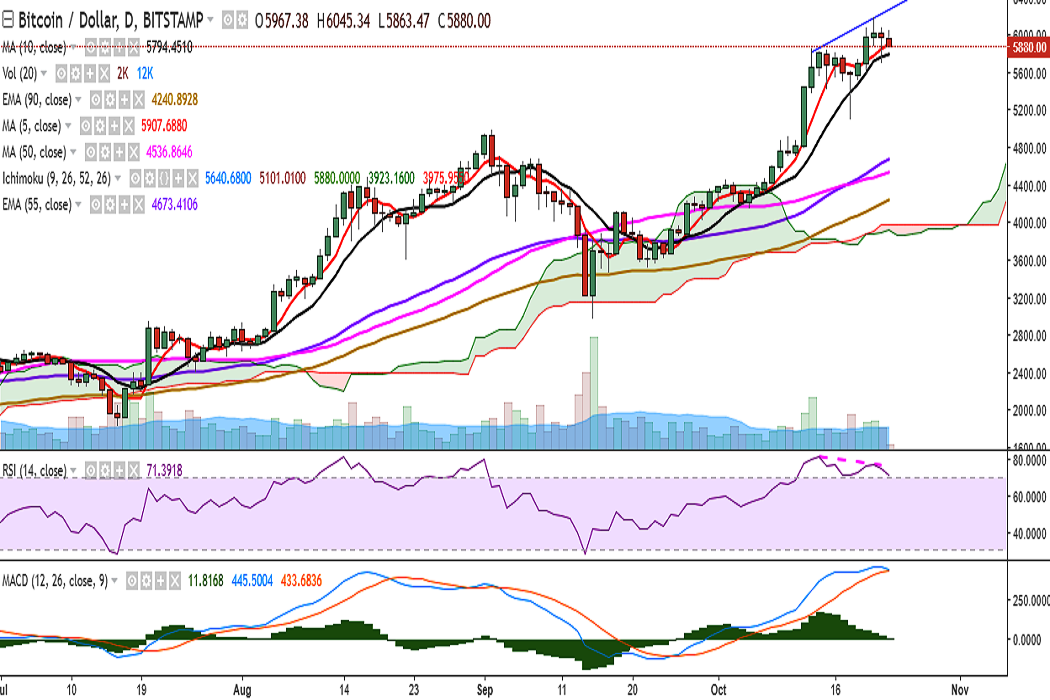
BTC/USD is trading in a close range after it hit a fresh all-time high at 6180 levels on October 21. It is currently trading at 5882 levels at the time of writing (Bitstamp).
Ichimoku analysis of daily chart:
Tenkan Sen: 5640.68
Kijun Sen: 5101.01
On the upside, a consistent break above 6000 levels would see the pair testing 6074 (October 20 high)/ 6180 (October 21 high)/ 6220 (161.8% retracement of 4979.90 and 2972.01). Further strength would see it testing 6266 (trend line joining 5846.43 and 6180)/6307 (161.8% retracement of 5848.43 and 5101.01)/6400.
On the flipside, support is seen at 5864 (1h 100-EMA) and a break below would target 5796 (10-DMA)/5679 (4h 55-EMA). Further weakness would drag it to 5422 (23.6% retracement of 2972.01 and 6180)/5265 (20-DMA).
Momentum studies: On the daily chart, RSI and stochs are in the overbought zone and MACD line is above the signal line. In addition, all major moving averages are biased higher suggest strong upward bias for the pair. However, caution is advised as bearish RSI divergence could be seen on the daily chart.
FxWirePro launches Absolute Return Managed Program. For more details, visit http://www.fxwirepro.com/invest


