


 FxWirePro- Major Crypto levels and bias summary
  FxWirePro- Major Crypto levels and bias summary
  FxWirePro- Major Crypto levels and bias summary
  FxWirePro- Major Crypto levels and bias summary
  Ethereum Cracks Under $1,700: Sell the Rally Near $1,750 as Bears Eye $1,380–$1,200
  BTC’s Bear Bounce: Sell the Rally Near $66K as Bears Target $59K–$52K Breakdown


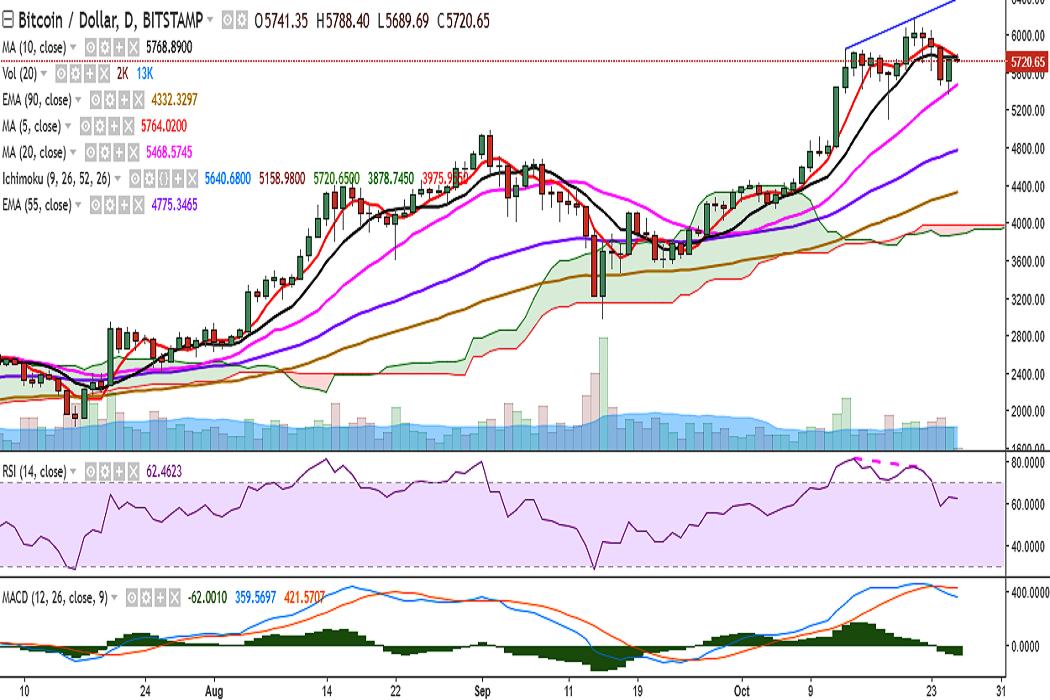
BTC/USD is trading in a close range on Thursday after it closed above 5700 levels on October 25. It is currently trading at 5739 levels at the time of writing (Bitstamp).
Ichimoku analysis of daily chart:
Tenkan Sen: 5640.68
Kijun Sen: 5158.98
The pair faces strong resistance at 5770 (10-DMA) and a consistent break above would target 5846 (October 13 high)/5943 (113% retracement of 5846.43 and 5101.36). Further strength would see it testing 6000/6180 (October 21 high).
On the reverse side, short-term support is seen at 5652 (2h 10-SMA) and any violation would see it testing 5525 (4h 90-EMA)/5468 (20-DMA). Further weakness would drag it to 5422 (23.6% retracement of 2972.01 and 6180)/5268 (1w 5-SMA).
Momentum studies: On the daily chart, stochs and 5-DMA are biased lower and MACD line is below the signal line. However, RSI is strong at 62. A decisive break below 20-DMA would confirm further bearishness in the pair.
FxWirePro launches Absolute Return Managed Program. For more details, visit http://www.fxwirepro.com/invest

- News

- Economy

- Central Banks
- Investing
- Research
- Roundups
- Digital Currency
- Insights
- Technical Analysis
- Technology
- Business
- Law
- Health
- Nature
- Fintech
- Science
- Topic
- Opinions
- ©Econometrics LLC . All Rights Reserved.
FxWirePro: BTC/USD faces strong resistance at 10-DMA, break below 20-DMA confirms bearishness
Thursday, October 26, 2017 6:30 AM UTC
Editor's Picks


- Market Data
Most Popular


3


