


 FxWirePro- Major Crypto levels and bias summary
  FxWirePro- Major Crypto levels and bias summary
  BTC’s Bear Bounce: Sell the Rally Near $66K as Bears Target $59K–$52K Breakdown
  Ethereum Cracks Under $1,700: Sell the Rally Near $1,750 as Bears Eye $1,380–$1,200
  FxWirePro- Major Crypto levels and bias summary


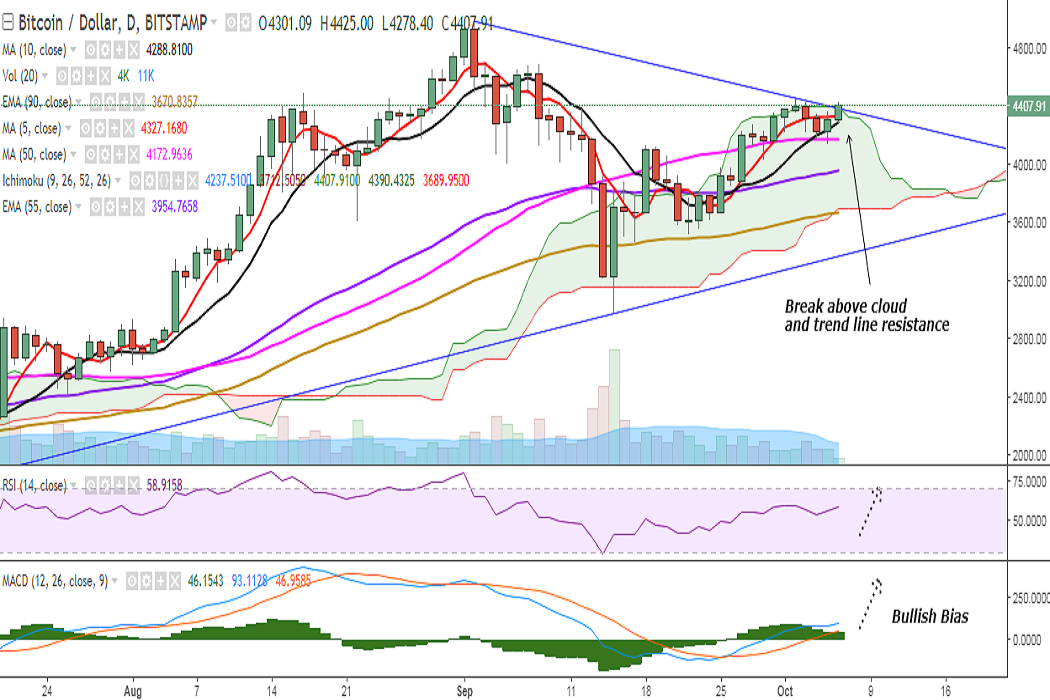
BTC/USD is trading higher on Friday as it broke above the trend line joining 4979.90 and 4453. It is currently trading at 4408 levels at the time of writing (Bitstamp).
Ichimoku analysis of daily chart:
Tenkan Sen: 4237.51
Kijun Sen: 3712.50
On the upside, the pair has broken above 4384 (trend line joining 4979.90 and 4453) and a consistent break above would 4480 (August 17 high)/ 4550 (78.6% retracement of 4979.90 and 2972.01). Further strength would see it testing 4679 (September 08 high)/4855 (127.2% extension of 2972.01 and 4453)/4979.90 (September 02 high).
On the flipside, support is seen at 4288 (10-DMA) and any violation would see it testing 4172 (50-DMA)/4103 (23.6% retracement of 2972.01 and 4453). Further weakness would drag it to 4044 (20-DMA)/4001 (September 05 low)/3954 (55-EMA)/3712.
Momentum studies: Bias appears to be turning bullish on the daily chart with the pair breaching trend line resistance, RSI strong at 58, and MACD line above the signal line. However, caution is advised as stochs are in the overbought zone.
FxWirePro launches Absolute Return Managed Program. For more details, visit http://www.fxwirepro.com/invest

- News

- Economy

- Central Banks
- Investing
- Research
- Roundups
- Digital Currency
- Insights
- Technical Analysis
- Technology
- Business
- Law
- Health
- Nature
- Fintech
- Science
- Topic
- Opinions
- ©Econometrics LLC . All Rights Reserved.
FxWirePro: BTC/USD breaches trend line resistance at 4384, close above targets 4480
Friday, October 6, 2017 10:40 AM UTC
Editor's Picks


- Market Data
Most Popular


3


