


 FxWirePro- Major Crypto levels and bias summary
  FxWirePro- Major Crypto levels and bias summary
  FxWirePro- Major Crypto levels and bias summary


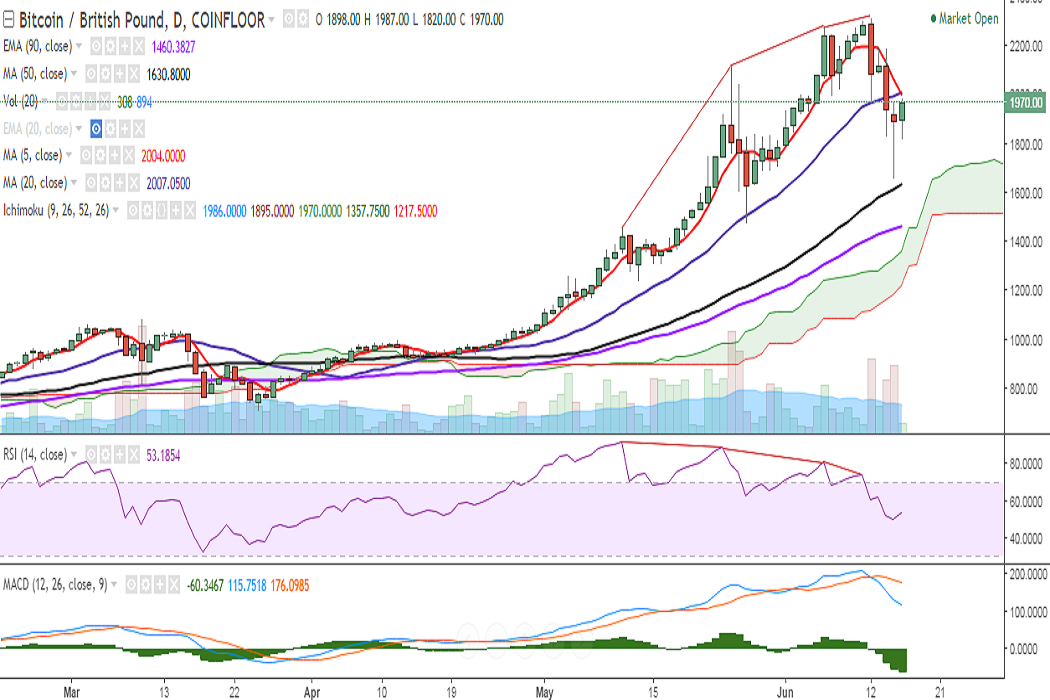
BTC/GBP dropped to 1657 levels on Thursday, as its upside is capped by 5-DMA. It is currently trading at 1968 levels at the time of writing (Coinfloor).
Ichimoku analysis of daily chart:
Tenkan Sen: 1986
Kijun Sen: 1895
On the upside, the pair faces immediate resistance at 2006 levels (20-DMA) and a consistent break would see a trend reversal, targeting 2099 (10-DMA)/2174 (78.6% retracement of 2315 and 1657 levels)/2277 (June 06 high).
On the flipside, support is seen at 1859 (1h 20-SMA) and any violation would see a dip till 1795 (61.8% retracement of 1475 and 2315)/1657 (June 15 low)/1630 (50-DMA).
Momentum studies: On the daily chart, RSI is at 52; stochs suggest lower bias, and MACD line is below the signal line. Also, 5- and 20-DMA are on the verge of a bearish crossover.
On the 2-hour chart, the death cross suggests a further possibility for a downside. The pair will run into resistance at 2031 (2h 50-SMA).
On the weekly chart, the pair is holding just above 5-SMA and RSI is at 73. A rollover of RSI from the overbought zone is likely to see further downside.
Call Update: The pair almost hit our targets given in the previous call.
Recommendation: Watch out for a break below 50-DMA for a further downtrend in the pair.

- News

- Economy

- Central Banks
- Investing
- Research
- Roundups
- Digital Currency
- Insights
- Technical Analysis
- Technology
- Business
- Law
- Health
- Nature
- Fintech
- Science
- Topic
- Opinions
- ©Econometrics LLC . All Rights Reserved.
FxWirePro: BTC/GBP trades just below 20-DMA, break below 50-DMA confirms bearishness
Friday, June 16, 2017 10:04 AM UTC
Editor's Picks


- Market Data
Most Popular


