


 FxWirePro- Major Crypto levels and bias summary
  FxWirePro- Major Crypto levels and bias summary
  Ethereum Cracks Under $1,700: Sell the Rally Near $1,750 as Bears Eye $1,380–$1,200


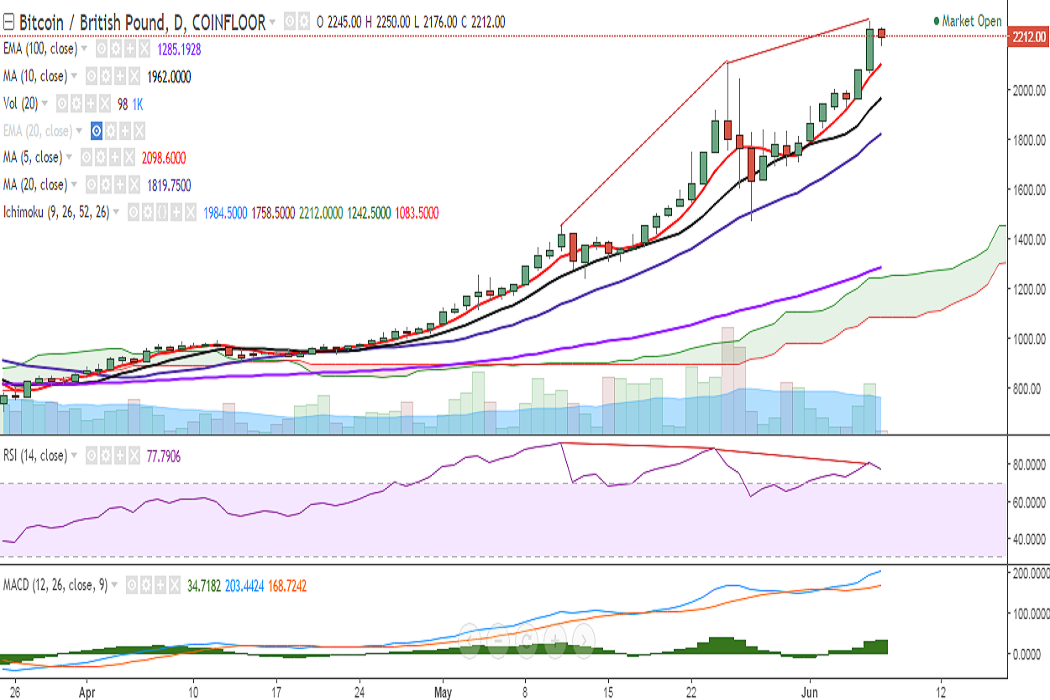
BTC/GBP in trading in a narrow range on Wednesday after it a fresh all-time high at 2277 levels on June 06. It is currently trading at 2212 levels at press time (Coinfloor).
Ichimoku analysis of daily chart:
Tenkan Sen: 1984.50
Kijun Sen: 1758.50
On the upside, a break above 2277 (June 06 high) would see the pair testing 2292 (127.2% retracement of 2118 and 1475)/2381 (113% extension of 1475 and 2277)/2495.
Momentum studies appear bullish on the daily chart with RSI, stochs, and MACD suggesting higher bias. However, caution is advised as RSI and Stochs are in overbought zone. Also, bearish RSI divergence could be seen on the daily chart.
In the 1-hour chart, the narrowing of the Bollinger suggests some consolidation around current levels.
Support is seen at 2151 (1h 50-SMA) and any violation would see a dip till 2094 (1h 90-EMA)/1962 (10-DMA).


