


 BTCUSD Holds Above 365 EMA as Bullish Momentum Builds Toward $70K
  Major Pair Action Bias: USDCHF Turns Bullish as EURUSD Stays Bearish – Key Pairs to Watch
  Major Pairs Bias: USDCHF Bullish While GBPUSD Turns Bearish
  FxWirePro: AUD/USD rallies on jobs surge, heads to test key resistance
  FxWirePro: GBP/NZD gains some upside momentum but still bearish
  FxWirePro- Major Pair levels and bias summary
  ETHUSD Breaks Above $1900 as Bulls Eye $2300 and Beyond
  JPY Action Bias: USDJPY, AUDJPY & EURJPY Turn Extremely Bullish – Top Pairs to Watch
  FxWirePro:USD/JPY holds above 163 as intervention fears keep traders on edge
  GBPJPY Weakens on Soft UK CPI: Sell Below 217.80 Targeting 216.40


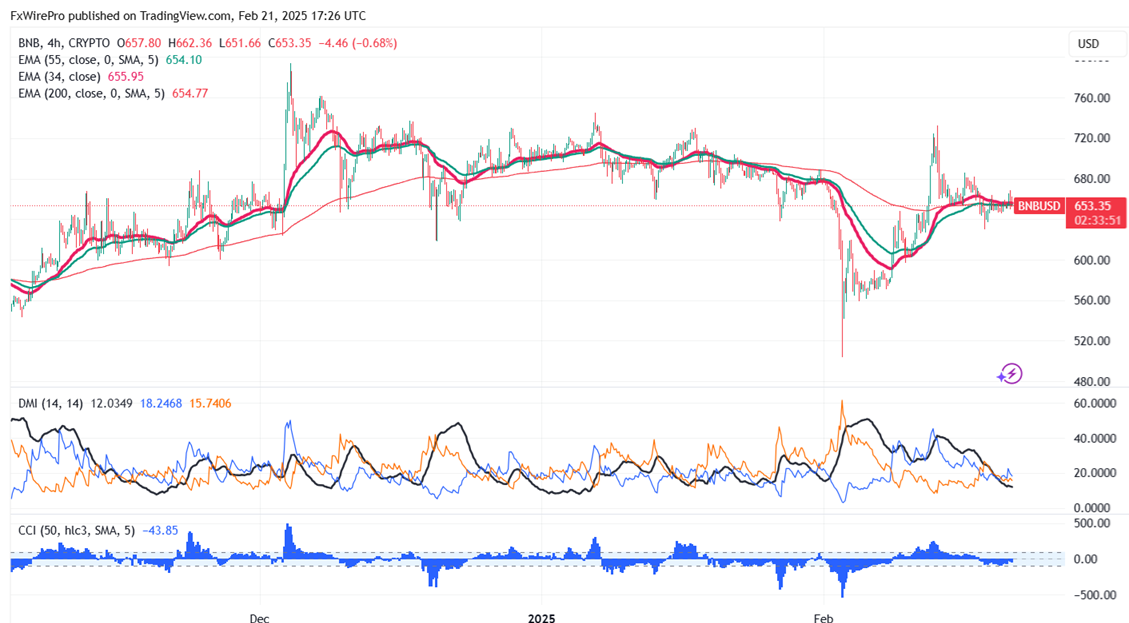
Key Level to Monitor: $660
BNB/USD pair lost its shine after forming a minor top of $732. It hit an intraday low of $630 and is currently trading around $651.75.
Overall bias remains bullish as long as support of $500 holds. It trades above the 34 and 55 EMA on the 4-hour chart. If the pair closes below $590, potentially leading to further declines towards $580/$550/$500.
Immediate Resistance is at $730. A successful breakout above this resistance could suggest bullish momentum, with further gains possible towards $775/$812/$848/$1000.
Indicators (4-Hour Chart)
- Directional Movement Index: Neutral
- CCI (50): Bearish
Trading Strategy
Consider buying on dips around $630 with a stop-loss set at $590 and a target price of $1000.


