


 FxWirePro: AUD/USD dips as dollar firms on Fed rate hike bets
  FxWirePro: EUR/AUD dips below 1.6200 level ,vulnerable to more downside
  FxWirePro: GBP/NZD gains some upside momentum but still bearish
  FxWirePro- Major Crypto levels and bias summary
  FxWirePro: USD/ZAR bearish again as upside bias reverses
  FxWirePro- Major Pair levels and bias summary
  FxWirePro- Woodies Pivot (Major)
  FxWirePro- Major Crypto levels and bias summary


 Add as a preferred source on Google
Key Level to Monitor: $600
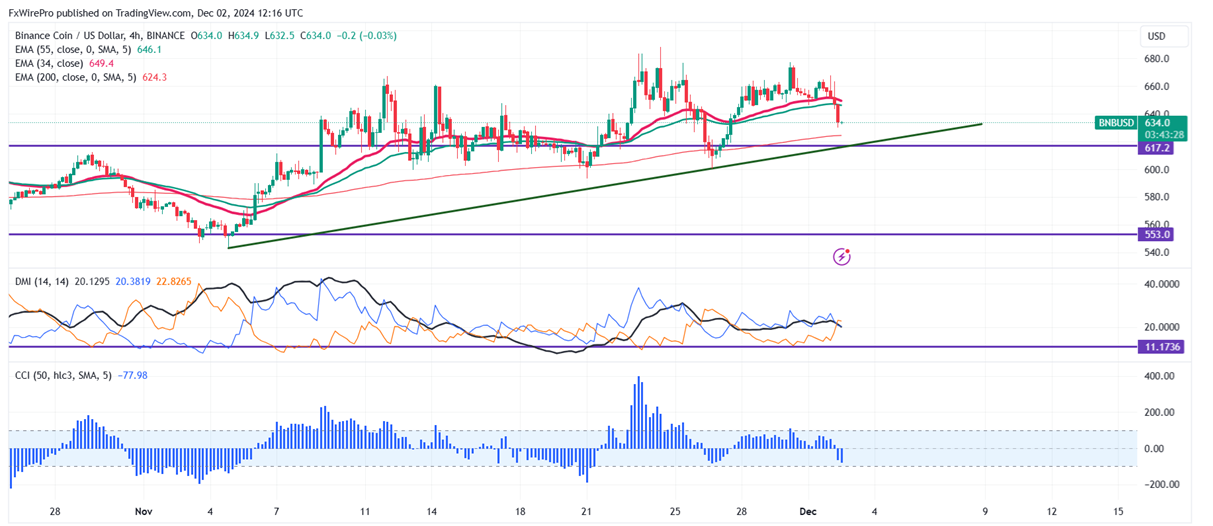
BNB/USD pair has been trading in a narrow range $688 and $600 for the past 7 days. It is currently trading at around $634. A closing price above $725 confirms further bullishness.
Intraday bias remains bullish as long as support $585 holds. It trades below the 34 and 55 EMA on the 4-hour chart. If the pair closes below $600, potentially leading to further declines towards $585/ $559,$545, $528, $500, and possibly down to $470.
Immediate Resistance is at $670. A successful breakout above this resistance could suggest bullish momentum, with further gains possible towards $700/$725.
Indicators (4-Hour Chart)
- Directional Movement Index: Neutral
- CCI (50): Bearish
Trading Strategy
Consider buying on dips around $600, with a stop-loss set at $550 and a target price of $700/$725.







